|
|
| View previous topic :: View next topic |
| Author |
trading education for the newbees -- experts pl help |
casper
Green Belt

Joined: 02 Oct 2010
Posts: 1315
|
Post: #31  Posted: Mon Dec 20, 2010 11:58 am Post subject: Re: seshareddy garu thanks for your involvement. Posted: Mon Dec 20, 2010 11:58 am Post subject: Re: seshareddy garu thanks for your involvement. |
 |
|
[quote="sherbaaz"] | Padkondu wrote: | Sesha sir
thanks for your involvement. ever since i started this thread, there has been a good responce from the experts. but the only agony is that no novice is asking questions here, except me.
regards
padkondu

Rest all are experts. 
Regards |
may be all. but definitely except me 
need to learn a lot and need to gather a lot exp to become expert
   
|
|
| Back to top |
|
 |
|
| |
Padkondu
White Belt

Joined: 23 Jan 2008
Posts: 120
|
| Post: #32 Posted: Tue Jan 04, 2011 9:19 pm Post subject: swing trade set up |
|
|
dear casper,
i back tested the set up you suggested with little modifications. pl go thro.
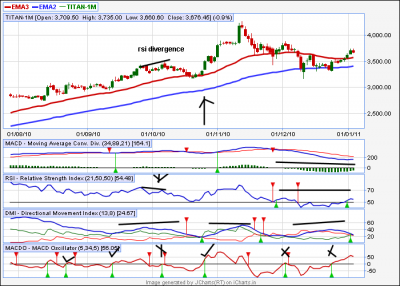
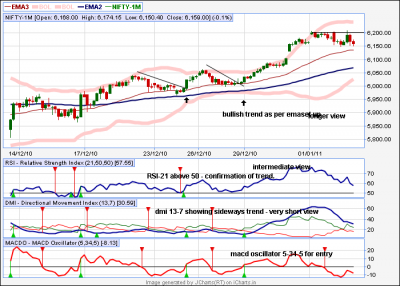
timeframe - 60min.
trend identification: 34-89 ema.
macd(34,89,21). though it gives the same information as 34-89 ema, i look at the histogram.
rsi-5.
Back ground:
(1)the ema set up and macd together they tell the short term trend in the time frame that is equivalant to 240min or 4 hours time frame. this allows us to understand how the stock is trading in relation to 4 hours time frame. this tells use to go long or short.
(2) RSI-5 with 50 line gives the current trend, i.e. the short term trend in the current time frame
(3) addition confirmation through the current time frame, short term trend with DMI(13,7).
(4) basing on the above, entry is made in the current time frame using macd oscillator(5,34,5) OR
(5) if market is strongly trending, i.e. dmi is above 40, we do not get signal from macd oscillator. then shift to 15 min timefram and take entry using CCI-3 or CCI-5 using
for entry i am using macd oscillator(5,34,5) to cpture the bottom on a pull back in an up trend and viceversa.
but if dmi is showing strong trends n i do not get a signal as per macd oscillator i go to 15 min tf and get in using cci-5.
here my effort is to get the effect of multi tf effect on single tf so as to simplify.
here we are taking into account 4hrs, 60min trend and finetune entry/exit in 15 min chart.
i hv been testing this.
for exits one can adopt their own strategy of using stops like atr or ema-low-high etc.
No longs when rsi is below 50 n vice versa.
take a note of rsi divergence if any into account.
for may actual trading i am following my own multi tf strategy. but
pl go thro.
i woul like to post some charts, including those failed using this system.
regards
padkondu
| Description: |
|
| Filesize: |
32.75 KB |
| Viewed: |
631 Time(s) |
|
| Description: |
|
| Filesize: |
36.33 KB |
| Viewed: |
597 Time(s) |
|
Last edited by Padkondu on Wed Jan 12, 2011 9:27 pm; edited 2 times in total |
|
| Back to top |
|
|
casper
Green Belt
Joined: 02 Oct 2010
Posts: 1315
|
| Post: #33 Posted: Tue Jan 04, 2011 11:38 pm Post subject: |
|
|
hi brother i have seen it, tomorrow i will test it and will post my result, today i am just exhausted
plz dont mind
specially i need some time to understand the indicator set ups properly
will post my findings as soon as possible
|
|
| Back to top |
|
|
Padkondu
White Belt
Joined: 23 Jan 2008
Posts: 120
|
| Post: #34 Posted: Wed Jan 12, 2011 10:08 pm Post subject: acc - failed signals |
|
|
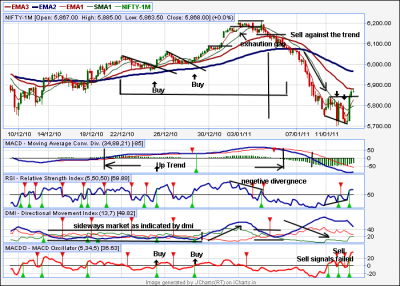
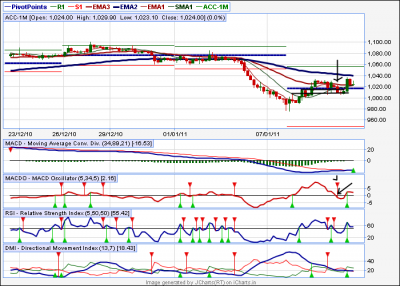
the two short signals to days failed, i stopped out. the steep fall prior to it could have caued mis behaviour of the macd oscillator. later i noticed positive divergence in rsi as the market moved.
need help on this.
regards
padkondu
| Description: |
|
| Filesize: |
46.59 KB |
| Viewed: |
585 Time(s) |
|
|
|
| Back to top |
|
|
casper
Green Belt
Joined: 02 Oct 2010
Posts: 1315
|
| Post: #35 Posted: Wed Jan 12, 2011 11:12 pm Post subject: |
|
|
hi brother
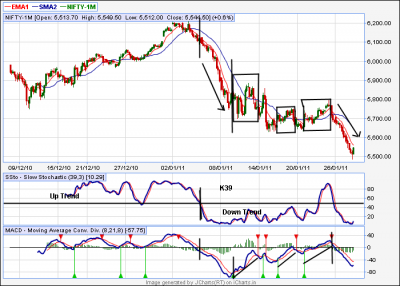
was it acc or nifty? ur file name and subject is acc but chart is nifty-1m
for nifty, apart from + div,i should say it came near the weekly s2 as well as psychological support of 5700 level and got support from there,
and for acc, it was a case of + dv around monthly s1 level which is more strong than weekly pivots levels
i would like to tell u that whenever to take a position make sure monthly/weekly pivots are not there to prevent the price movement
|
|
| Back to top |
|
|
Padkondu
White Belt
Joined: 23 Jan 2008
Posts: 120
|
| Post: #36 Posted: Wed Jan 12, 2011 11:20 pm Post subject: |
|
|
| casper wrote: | hi brother
was it acc or nifty? ur file name and subject is acc but chart is nifty-1m
for nifty, apart from + div,i should say it came near the weekly s2 as well as psychological support of 5700 level and got support from there,
and for acc, it was a case of + dv around monthly s1 level which is more strong than weekly pivots levels
i would like to tell u that whenever to take a position make sure monthly/weekly pivots are not there to prevent the price movement |
Hi sir,
actually, it is the case with nifty as well as acc, both i went short, and stopped out. now on i shall keep watching monthly and weekly pivots apart from rsi-observations.
regards
padkondu
|
|
| Back to top |
|
|
Padkondu
White Belt
Joined: 23 Jan 2008
Posts: 120
|
| Post: #37 Posted: Wed Jan 12, 2011 11:54 pm Post subject: |
|
|
| Padkondu wrote: | | casper wrote: | hi brother
was it acc or nifty? ur file name and subject is acc but chart is nifty-1m
for nifty, apart from + div,i should say it came near the weekly s2 as well as psychological support of 5700 level and got support from there,
and for acc, it was a case of + dv around monthly s1 level which is more strong than weekly pivots levels
i would like to tell u that whenever to take a position make sure monthly/weekly pivots are not there to prevent the price movement |
Hi sir,
actually, it is the case with nifty as well as acc, both i went short, and stopped out. now on i shall keep watching monthly and weekly pivots apart from rsi-observations.
regards
padkondu |
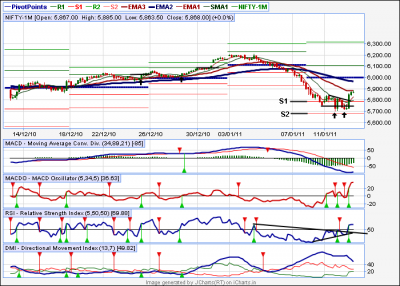
Casper Sir,
here i have the same charts, with pivots this time,
nifty with weekly pivot:-
each sell signal came along with breach of previou swing low, at 5746.80 and there was much room either towards s1 (5787) or towards s2
(5682).
regarding acc i took short position on breah of weekly pivot, on close of the candle at 10:59. macd oscillator(5,34,5) sell signal. am i right?
padkondu
| Description: |
|
| Filesize: |
34.55 KB |
| Viewed: |
597 Time(s) |
|
| Description: |
|
| Filesize: |
34.88 KB |
| Viewed: |
564 Time(s) |
|
|
|
| Back to top |
|
|
casper
Green Belt
Joined: 02 Oct 2010
Posts: 1315
|
| Post: #38 Posted: Thu Jan 13, 2011 8:26 am Post subject: |
|
|
it was too volatile market, and the total fall came within a big red 60 min candle. i want to say when u see a big candle is forming and closing near a support/resistance level and it is away from support level from just 20-30 NIFTY points avoid it untill the support /resistance is breached there is still very much chance to bounce back from the level
what i wrote above is about index in 60 min tf, in a volatile market, an index like nifty moves with 100-200 points range, so 20-30 points are just decimal to that
i have seen it many a times that support/resistance level works like a zone rather than a number
in case of a stock, say a 100rupees stock, u will see that it is getting support/resistance from the pivot level with +/- 1 rupee in average, this 100 rupee stock is supposed to move maximum 5 rupees per day, so here pivots with +/- 1 rupee gives good support/resistance
so whenever u see that u r reaching any support/resistance level. be it pivot or 34 ema or 89 ema, dont go by the exact number, u should expect that zone, until breached by a candle close, will offer troubles to u.
say u r bear u will short NF, and i am bull, i will buy NF
u will short when S1 is gone,(in this particular case, u had no time because of market volatility which results in a free fall)
and me, being a bull, will buy with a sl of S2, so if u think liike this, then what is ur target is my sl
now if my power is greater than u then i will make the price bounce back much before the exact S2 zone, and if ur power is greater than me then u will wipe my sl out, so here volatility will increase heavily,
now market was already volatile, then with this fight, volatility increased much more, and it is true that u can hardly predict that who will win at that time, thats why i am advising u to stay away from the trade until any of them convincingly wins (which would be decided by a candle close only)
thats why i wrote do not take position too near the support/resistance level
and one more thing. I AM UR BROTHER, NOT SIR
|
|
| Back to top |
|
|
Padkondu
White Belt
Joined: 23 Jan 2008
Posts: 120
|
| Post: #39 Posted: Thu Jan 13, 2011 9:09 am Post subject: Re |
|
|
| casper wrote: | it was too volatile market, and the total fall came within a big red 60 min candle. i want to say when u see a big candle is forming and closing near a support/resistance level and it is away from support level from just 20-30 NIFTY points avoid it untill the support /resistance is breached there is still very much chance to bounce back from the level
what i wrote above is about index in 60 min tf, in a volatile market, an index like nifty moves with 100-200 points range, so 20-30 points are just decimal to that
i have seen it many a times that support/resistance level works like a zone rather than a number
in case of a stock, say a 100rupees stock, u will see that it is getting support/resistance from the pivot level with +/- 1 rupee in average, this 100 rupee stock is supposed to move maximum 5 rupees per day, so here pivots with +/- 1 rupee gives good support/resistance
so whenever u see that u r reaching any support/resistance level. be it pivot or 34 ema or 89 ema, dont go by the exact number, u should expect that zone, until breached by a candle close, will offer troubles to u.
say u r bear u will short NF, and i am bull, i will buy NF
u will short when S1 is gone,(in this particular case, u had no time because of market volatility which results in a free fall)
and me, being a bull, will buy with a sl of S2, so if u think liike this, then what is ur target is my sl
now if my power is greater than u then i will make the price bounce back much before the exact S2 zone, and if ur power is greater than me then u will wipe my sl out, so here volatility will increase heavily,
now market was already volatile, then with this fight, volatility increased much more, and it is true that u can hardly predict that who will win at that time, thats why i am advising u to stay away from the trade until any of them convincingly wins (which would be decided by a candle close only)
thats why i wrote do not take position too near the support/resistance level
and one more thing. I AM UR BROTHER, NOT SIR |
Hi brother,
thanks for you time and effort in clarifying my doubts. this is useful not only for me but also to those who visit this thread.
regards.
padkondu
|
|
| Back to top |
|
|
aromal
White Belt
Joined: 22 Mar 2010
Posts: 302
|
| Post: #40 Posted: Thu Jan 13, 2011 8:50 pm Post subject: new bees |
|
|
| Padkondu wrote: | | casper wrote: | it was too volatile market, and the total fall came within a big red 60 min candle. i want to say when u see a big candle is forming and closing near a support/resistance level and it is away from support level from just 20-30 NIFTY points avoid it untill the support /resistance is breached there is still very much chance to bounce back from the level
what i wrote above is about index in 60 min tf, in a volatile market, an index like nifty moves with 100-200 points range, so 20-30 points are just decimal to that
i have seen it many a times that support/resistance level works like a zone rather than a number
in case of a stock, say a 100rupees stock, u will see that it is getting support/resistance from the pivot level with +/- 1 rupee in average, this 100 rupee stock is supposed to move maximum 5 rupees per day, so here pivots with +/- 1 rupee gives good support/resistance
so whenever u see that u r reaching any support/resistance level. be it pivot or 34 ema or 89 ema, dont go by the exact number, u should expect that zone, until breached by a candle close, will offer troubles to u.
say u r bear u will short NF, and i am bull, i will buy NF
u will short when S1 is gone,(in this particular case, u had no time because of market volatility which results in a free fall)
and me, being a bull, will buy with a sl of S2, so if u think liike this, then what is ur target is my sl
now if my power is greater than u then i will make the price bounce back much before the exact S2 zone, and if ur power is greater than me then u will wipe my sl out, so here volatility will increase heavily,
now market was already volatile, then with this fight, volatility increased much more, and it is true that u can hardly predict that who will win at that time, thats why i am advising u to stay away from the trade until any of them convincingly wins (which would be decided by a candle close only)
thats why i wrote do not take position too near the support/resistance level
and one more thing. I AM UR BROTHER, NOT SIR |
Hi brother,
thanks for you time and effort in clarifying my doubts. this is useful not only for me but also to those who visit this thread.
regards.
padkondu |
| Quote: | | Code: | | [list][list=][img][/img][url][/url][/list][/list] |
|
| Code: | | [url][quote] [smilie=aeom.gif] hi new bees... i was a new bees.... but not any more..... i learned a lot...... wat i have to say is that please observe and spend time in market...... in the initial stages just observe and trade rsi divergence or break out...... in initial stages small in small quantity......in forum both laymans aproch and nvk set is good handled by sumesh sol and casper......... keep working and ty to learn from sout box.............. [smilie=bheem.gif] then u can beet market like this[/quote][/url] |
|
|
| Back to top |
|
|
Padkondu
White Belt
Joined: 23 Jan 2008
Posts: 120
|
| Post: #41 Posted: Sat Jan 15, 2011 1:37 am Post subject: My Note Book |
|
|
Hi folks!
I am attaching a doc file along with this post with the notes i am preparing on our subject matter. i shall keep up dating my notes (doc file) periodically to add, enhance and improve the subject matter. i thought it could be usefuly to you if i share with you. it will be useful to me tooo, since i get suggestions. finally, we may have a small booklet on tech analysis.
regards
padkondu
| Description: |
|

Download |
| Filename: |
My Notes.doc |
| Filesize: |
535 KB |
| Downloaded: |
815 Time(s) |
|
|
| Back to top |
|
|
aromal
White Belt
Joined: 22 Mar 2010
Posts: 302
|
| Post: #42 Posted: Sat Jan 15, 2011 8:22 am Post subject: Re: My Note Book |
|
|
| Padkondu wrote: | Hi folks!
I am attaching a doc file along with this post with the notes i am preparing on our subject matter. i shall keep up dating my notes (doc file) periodically to add, enhance and improve the subject matter. i thought it could be usefuly to you if i share with you. it will be useful to me tooo, since i get suggestions. finally, we may have a small booklet on tech analysis.
regards
padkondu |
hi guys trading is all about following one system...... a good system, u keep on following one u will become expert then u can enjoy market and profit....... so keep working in small quantity till that time u et regular income from market 
|
|
| Back to top |
|
|
aromal
White Belt
Joined: 22 Mar 2010
Posts: 302
|
| Post: #43 Posted: Sat Jan 15, 2011 8:28 am Post subject: Re: new bees |
|
|
| aromal wrote: | | Padkondu wrote: | | casper wrote: | it was too volatile market, and the total fall came within a big red 60 min candle. i want to say when u see a big candle is forming and closing near a support/resistance level and it is away from support level from just 20-30 NIFTY points avoid it untill the support /resistance is breached there is still very much chance to bounce back from the level
what i wrote above is about index in 60 min tf, in a volatile market, an index like nifty moves with 100-200 points range, so 20-30 points are just decimal to that
i have seen it many a times that support/resistance level works like a zone rather than a number
in case of a stock, say a 100rupees stock, u will see that it is getting support/resistance from the pivot level with +/- 1 rupee in average, this 100 rupee stock is supposed to move maximum 5 rupees per day, so here pivots with +/- 1 rupee gives good support/resistance
so whenever u see that u r reaching any support/resistance level. be it pivot or 34 ema or 89 ema, dont go by the exact number, u should expect that zone, until breached by a candle close, will offer troubles to u.
say u r bear u will short NF, and i am bull, i will buy NF
u will short when S1 is gone,(in this particular case, u had no time because of market volatility which results in a free fall)
and me, being a bull, will buy with a sl of S2, so if u think liike this, then what is ur target is my sl
now if my power is greater than u then i will make the price bounce back much before the exact S2 zone, and if ur power is greater than me then u will wipe my sl out, so here volatility will increase heavily,
now market was already volatile, then with this fight, volatility increased much more, and it is true that u can hardly predict that who will win at that time, thats why i am advising u to stay away from the trade until any of them convincingly wins (which would be decided by a candle close only)
thats why i wrote do not take position too near the support/resistance level
and one more thing. I AM UR BROTHER, NOT SIR |
Hi brother,
thanks for you time and effort in clarifying my doubts. this is useful not only for me but also to those who visit this thread.
regards.
padkondu |
| Quote: | | Code: | | [list][list=][img][/img][url][/url][/list][/list] |
|
| Code: | | [url][quote] [smilie=aeom.gif] hi new bees... i was a new bees.... but not any more..... i learned a lot...... wat i have to say is that please observe and spend time in market...... in the initial stages just observe and trade rsi divergence or break out...... in initial stages small in small quantity......in forum both laymans aproch and nvk set is good handled by sumesh sol and casper......... keep working and ty to learn from sout box.............. [smilie=bheem.gif] then u can beet market like this[/quote][/url] |
|
 some one who just following bollinger band also can ejoy profits its all about experience some one who just following bollinger band also can ejoy profits its all about experience
|
|
| Back to top |
|
|
Padkondu
White Belt
Joined: 23 Jan 2008
Posts: 120
|
| Post: #44 Posted: Sun Jan 16, 2011 6:42 pm Post subject: Re: My Note Book |
|
|
| aromal wrote: | | Padkondu wrote: | Hi folks!
I am attaching a doc file along with this post with the notes i am preparing on our subject matter. i shall keep up dating my notes (doc file) periodically to add, enhance and improve the subject matter. i thought it could be usefuly to you if i share with you. it will be useful to me tooo, since i get suggestions. finally, we may have a small booklet on tech analysis.
regards
padkondu |
hi guys trading is all about following one system...... a good system, u keep on following one u will become expert then u can enjoy market and profit....... so keep working in small quantity till that time u et regular income from market |
Hi Aromal!
thanks for your interaction. thanks for the i-charts forum too, for bringing out some trading strategies. but the missing thing is the functionality of the trading system. any trading system includes some indicators or some other parameter. so without knowing the background and working of these indicators if we start trading a system, we are certain loose, ofcourse, we gain some experience. so what i try here is to bring some basic knwoledge of the most common and most powerful indicators and understand their functionality, behaviour, and backgournd. and discuss the same.
pl go through the doc file, where i discussed the trend lines, the easiest and the most powerful tool ot tech analysis, when you get some time and respond with some suggestions.
regards
padkondu
|
|
| Back to top |
|
|
Padkondu
White Belt
Joined: 23 Jan 2008
Posts: 120
|
| Post: #45 Posted: Sat Jan 29, 2011 7:05 pm Post subject: Trend Identification |
|
|
Dear friends
Trend identification is always a major challenge before the trader in any time frame. then i worked with DMI. it is really an excellent indicator to indicate whether market is trending or non-trending. but it is a much lagging indicator, i used it 13,7 parameters. most of the times, by the time it shows a real good trend as per norms, the market has already moved far. often by the time dmi shows the real trend, market begins to go sideways or the trend begings to fade. one need to expertise on trend. with all this, i like dmi, since i know from dmi, when not to trade a trending strategy.
later i made an observation;
market goes sideways in lower time frame (say 15min) when ever there is a conflict of trend with higher time frame (say 60 min).
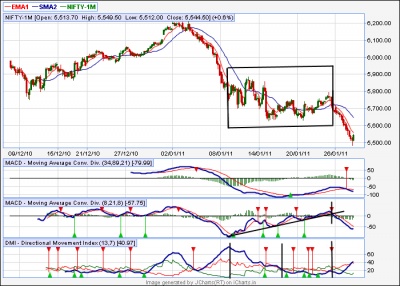
let me be more clear. if a higher timeframe is trending up wards (say 60 min) and lower timeframe is acting agains it (say 15 min time frame), the market results in a sidways movement in lower time frame. similarly, if both 15 min and 60 min are showing the same trend then only the market moves in good trend. so then i thought of getting both the trends in one time frame. we can do this only by using macd.
so i took macd(34,89,21) which is equivalent to short term trend indicator in 4 times higher timeframe. then i took the short term trend indicator for the current time frame, i.e. macd (8,17,9) or macd (12,26,9). i noticed that when ever these moving averages are conflicting the market goes sideways. and when ever they move in one direction sa up or down, the market is trending. further, the beginning of real trends can be captured earlier, compared to dmi. i keep dmi also, just for the sake of comparison.
i checked this for as large as 100 days data on nifty. good clues cand be drawn from this.
though i did not include it in my strategy, i am just working on it. so friends you can also post your openions on this.
regards
padkondu.
| Description: |
| MACD(8,21,8) and slow stachastiks (39,3) |
|
| Filesize: |
36.51 KB |
| Viewed: |
582 Time(s) |
|
| Description: |
|
| Filesize: |
34.24 KB |
| Viewed: |
558 Time(s) |
|
|
|
| Back to top |
|
|
|
|
You cannot post new topics in this forum
You cannot reply to topics in this forum
You cannot edit your posts in this forum
You cannot delete your posts in this forum
You cannot vote in polls in this forum
You can attach files in this forum
You can download files in this forum
|
Powered by phpBB © 2001, 2005 phpBB Group
|
|
|


