|
|
| View previous topic :: View next topic |
| Author |
trading education for the newbees -- experts pl help |
Padkondu
White Belt

Joined: 23 Jan 2008
Posts: 120
|
Post: #1  Posted: Tue Sep 14, 2010 7:29 pm Post subject: trading education for the newbees -- experts pl help Posted: Tue Sep 14, 2010 7:29 pm Post subject: trading education for the newbees -- experts pl help |
 |
|
Hi all
this is for those who are new to technical analysis and for those who whish to hep the newbees. experts! you can become good mentors too.... 
the field of technical is as complicated as designing an aeroplane. at the same time it is as simple as making a paper air-craft.
it becomes simple for those who understand the matrix of technical indicators, chart patterns, chandle stick patterns and finally good trading systems at disposal, all seen side by side and finding co-relation.
(see the example posted at the end)

for the newbees it is always a confusion. then i thought of starting this thread, that educates the newbees. experts may please respond to the doubts about strategies, technical indicators and patterns.
the most common problem of the newbees are detailed as below. any other things may also be posted here about technical analysis.
1) Time-Frame: one big problem for the beginners is choosing a time frame. what each time frame is like, who can fit in to each time frame. for example i am still in confusion, choosing between 60+15 min time frame and daily+60min time frame. what can ne expected of each time frame. just like strategies, there are good times and bad times for each timeframe. during the recent past, daily time frame was futile since nifty was trading in a range while 60 min timframe would have given better returns. which is better for swing trading? the benifits and drawbacks of each timeframe. for example 5 min+1 min involves lot of action, and is good for scalper who get in and out of trade for ver small returns, where as 15 min+5 min time frame could also give almost the same returns with relatively less stress. what is the profit objective of each time frame? what is the "span of trades" for each time frame. risk rewar ratio for each time frame etc.
2) Technical Indicators: second bigges challange for the beginners is choosing indicators, and their parameters. there is difference between trader to trader while choosing indicators for the same time frame. parameters of each indicator are there with set objectives.
for example while using movings averages,
5,13 ema/sma set will give detailed movements, u can get even very small swings.
8,21 ema/sma is also like above, good while using with stocks
13,34 ema/sma set up will catch intermediate swings, may not suit for those who want more action. but this is better in one way, as there is less wipsaws.
5,13,34 ema/sma/ema set up is still better with less wipsaws.
as such indicator parameters may vary with the objectives of the user. if there is stuff before them with the details of each parameter as above for some important indicatos, the beginners can choose. do we have to experimint with each indicator/parameter, with valuable resources, despite resources of great experts over here?
3) strategies: this is one more thing that bothers the beginners. one particular strategy may work in a particula market condition but result in loss in another market condition.
for example the two time frame trend following strategy using daily+60 time frame during the recent past "sideways movent" , while the same strategy may have given good returns with 60+15 min time frame. only experience traders swith between strategies and time frame basing on market conditions. such thigs can be of good use for beginners.
there could be another strategy for use during side ways market conditions. but identification of sideways/trend is related to timeframe.
so one needs to have atleast one to deal with trending markets and another to deal with side ways market. this is particularly for swing traders who want to carry position for a couple of days.
4) understanding indicators: this is one big question before the newbees. for example if one is following dmi/adx, by the time the trend evolves as per this indicator, the trend begins to fade in the real market conditions. there is some defect. the defect is not with the system, but the application of the system in an inappropriate market condition or an inapproprate timeframe for a particual market condition.
there can be several big problems/doubts.
this is where the experts can be of good use to the newbees. of course, for thos who wish to share their knowledge.
now i have a situation here: the example i mentioned above
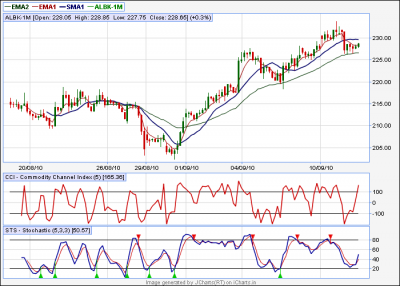
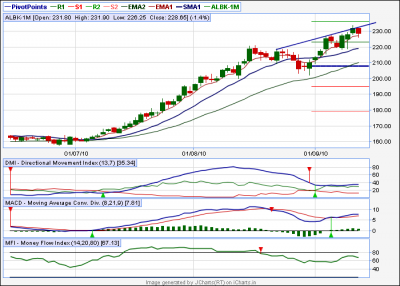
ALBK on daily charts. there is a good trend in place as per dmi, adx is rising only very slightly. macd is also indicating good trend. histogram(divergence) above 0-line. moving averages are showing good up trend.
(daily chart is posted below)
then i switche to 60 min chart, took position on CCI(5) buy signal. even STS(5,3,3) also gave a buy.
now my problem is, there is a bearish engulfing in daily charts.
was i right or wrong in taking a position to day
| Description: |
|
| Filesize: |
40.63 KB |
| Viewed: |
677 Time(s) |
|
| Description: |
|
| Filesize: |
30.98 KB |
| Viewed: |
643 Time(s) |
|
|
|
| Back to top |
|
 |
|
| |
Padkondu
White Belt
Joined: 23 Jan 2008
Posts: 120
|
| Post: #2 Posted: Tue Sep 14, 2010 8:46 pm Post subject: indiavix at lowest |
|
|
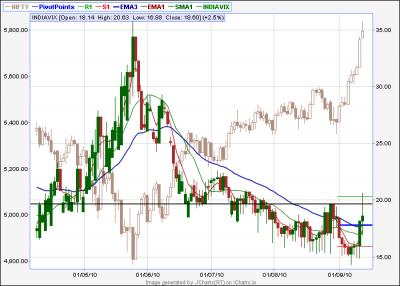
dear sir, i have the indiavix chart with nifty chart. indiavix seems to be bottomed out by forming a candle above m.a combination. does this mean the end of the trend for nifty?
| Description: |
|
| Filesize: |
23.73 KB |
| Viewed: |
624 Time(s) |
|
|
|
| Back to top |
|
|
amitsaraf21
White Belt
Joined: 20 Feb 2009
Posts: 76
|
| Post: #3 Posted: Tue Sep 14, 2010 9:16 pm Post subject: Re: trading education for the newbees -- experts pl help |
|
|
| Padkondu wrote: | Hi all
this is for those who are new to technical analysis and for those who whish to hep the newbees. experts! you can become good mentors too....
the field of technical is as complicated as designing an aeroplane. at the same time it is as simple as making a paper air-craft.
it becomes simple for those who understand the matrix of technical indicators, chart patterns, chandle stick patterns and finally good trading systems at disposal, all seen side by side and finding co-relation.
(see the example posted at the end)
for the newbees it is always a confusion. then i thought of starting this thread, that educates the newbees. experts may please respond to the doubts about strategies, technical indicators and patterns.
the most common problem of the newbees are detailed as below. any other things may also be posted here about technical analysis.
1) Time-Frame: one big problem for the beginners is choosing a time frame. what each time frame is like, who can fit in to each time frame. for example i am still in confusion, choosing between 60+15 min time frame and daily+60min time frame. what can ne expected of each time frame. just like strategies, there are good times and bad times for each timeframe. during the recent past, daily time frame was futile since nifty was trading in a range while 60 min timframe would have given better returns. which is better for swing trading? the benifits and drawbacks of each timeframe. for example 5 min+1 min involves lot of action, and is good for scalper who get in and out of trade for ver small returns, where as 15 min+5 min time frame could also give almost the same returns with relatively less stress. what is the profit objective of each time frame? what is the "span of trades" for each time frame. risk rewar ratio for each time frame etc.
2) Technical Indicators: second bigges challange for the beginners is choosing indicators, and their parameters. there is difference between trader to trader while choosing indicators for the same time frame. parameters of each indicator are there with set objectives.
for example while using movings averages,
5,13 ema/sma set will give detailed movements, u can get even very small swings.
8,21 ema/sma is also like above, good while using with stocks
13,34 ema/sma set up will catch intermediate swings, may not suit for those who want more action. but this is better in one way, as there is less wipsaws.
5,13,34 ema/sma/ema set up is still better with less wipsaws.
as such indicator parameters may vary with the objectives of the user. if there is stuff before them with the details of each parameter as above for some important indicatos, the beginners can choose. do we have to experimint with each indicator/parameter, with valuable resources, despite resources of great experts over here?
3) strategies: this is one more thing that bothers the beginners. one particular strategy may work in a particula market condition but result in loss in another market condition.
for example the two time frame trend following strategy using daily+60 time frame during the recent past "sideways movent" , while the same strategy may have given good returns with 60+15 min time frame. only experience traders swith between strategies and time frame basing on market conditions. such thigs can be of good use for beginners.
there could be another strategy for use during side ways market conditions. but identification of sideways/trend is related to timeframe.
so one needs to have atleast one to deal with trending markets and another to deal with side ways market. this is particularly for swing traders who want to carry position for a couple of days.
4) understanding indicators: this is one big question before the newbees. for example if one is following dmi/adx, by the time the trend evolves as per this indicator, the trend begins to fade in the real market conditions. there is some defect. the defect is not with the system, but the application of the system in an inappropriate market condition or an inapproprate timeframe for a particual market condition.
there can be several big problems/doubts.
this is where the experts can be of good use to the newbees. of course, for thos who wish to share their knowledge.
now i have a situation here: the example i mentioned above
ALBK on daily charts. there is a good trend in place as per dmi, adx is rising only very slightly. macd is also indicating good trend. histogram(divergence) above 0-line. moving averages are showing good up trend.
(daily chart is posted below)
then i switche to 60 min chart, took position on CCI(5) buy signal. even STS(5,3,3) also gave a buy.
now my problem is, there is a bearish engulfing in daily charts.
was i right or wrong in taking a position to day |
|
|
| Back to top |
|
|
nsinojia
Yellow Belt

Joined: 21 Dec 2009
Posts: 624
|
| Post: #4 Posted: Tue Sep 14, 2010 9:19 pm Post subject: i m not expert but i will try to rectify and help |
|
|
i m not an expert but i will try to rectify and help you if needed otherwise u r on right track and in right public(family) forum SB 
|
|
| Back to top |
|
|
amitsaraf21
White Belt
Joined: 20 Feb 2009
Posts: 76
|
| Post: #5 Posted: Tue Sep 14, 2010 10:26 pm Post subject: Re: trading education for the newbees -- experts pl help |
|
|
| Padkondu wrote: | Hi all
this is for those who are new to technical analysis and for those who whish to hep the newbees. experts! you can become good mentors too....
the field of technical is as complicated as designing an aeroplane. at the same time it is as simple as making a paper air-craft.
it becomes simple for those who understand the matrix of technical indicators, chart patterns, chandle stick patterns and finally good trading systems at disposal, all seen side by side and finding co-relation.
(see the example posted at the end)
for the newbees it is always a confusion. then i thought of starting this thread, that educates the newbees. experts may please respond to the doubts about strategies, technical indicators and patterns.
the most common problem of the newbees are detailed as below. any other things may also be posted here about technical analysis.
1) Time-Frame: one big problem for the beginners is choosing a time frame. what each time frame is like, who can fit in to each time frame. for example i am still in confusion, choosing between 60+15 min time frame and daily+60min time frame. what can ne expected of each time frame. just like strategies, there are good times and bad times for each timeframe. during the recent past, daily time frame was futile since nifty was trading in a range while 60 min timframe would have given better returns. which is better for swing trading? the benifits and drawbacks of each timeframe. for example 5 min+1 min involves lot of action, and is good for scalper who get in and out of trade for ver small returns, where as 15 min+5 min time frame could also give almost the same returns with relatively less stress. what is the profit objective of each time frame? what is the "span of trades" for each time frame. risk rewar ratio for each time frame etc.
2) Technical Indicators: second bigges challange for the beginners is choosing indicators, and their parameters. there is difference between trader to trader while choosing indicators for the same time frame. parameters of each indicator are there with set objectives.
for example while using movings averages,
5,13 ema/sma set will give detailed movements, u can get even very small swings.
8,21 ema/sma is also like above, good while using with stocks
13,34 ema/sma set up will catch intermediate swings, may not suit for those who want more action. but this is better in one way, as there is less wipsaws.
5,13,34 ema/sma/ema set up is still better with less wipsaws.
as such indicator parameters may vary with the objectives of the user. if there is stuff before them with the details of each parameter as above for some important indicatos, the beginners can choose. do we have to experimint with each indicator/parameter, with valuable resources, despite resources of great experts over here?
3) strategies: this is one more thing that bothers the beginners. one particular strategy may work in a particula market condition but result in loss in another market condition.
for example the two time frame trend following strategy using daily+60 time frame during the recent past "sideways movent" , while the same strategy may have given good returns with 60+15 min time frame. only experience traders swith between strategies and time frame basing on market conditions. such thigs can be of good use for beginners.
there could be another strategy for use during side ways market conditions. but identification of sideways/trend is related to timeframe.
so one needs to have atleast one to deal with trending markets and another to deal with side ways market. this is particularly for swing traders who want to carry position for a couple of days.
4) understanding indicators: this is one big question before the newbees. for example if one is following dmi/adx, by the time the trend evolves as per this indicator, the trend begins to fade in the real market conditions. there is some defect. the defect is not with the system, but the application of the system in an inappropriate market condition or an inapproprate timeframe for a particual market condition.
there can be several big problems/doubts.
this is where the experts can be of good use to the newbees. of course, for thos who wish to share their knowledge.
now i have a situation here: the example i mentioned above
ALBK on daily charts. there is a good trend in place as per dmi, adx is rising only very slightly. macd is also indicating good trend. histogram(divergence) above 0-line. moving averages are showing good up trend.
(daily chart is posted below)
then i switche to 60 min chart, took position on CCI(5) buy signal. even STS(5,3,3) also gave a buy.
now my problem is, there is a bearish engulfing in daily charts.
was i right or wrong in taking a position to day |
|
|
| Back to top |
|
|
Padkondu
White Belt
Joined: 23 Jan 2008
Posts: 120
|
| Post: #6 Posted: Mon Sep 20, 2010 9:09 pm Post subject: HS chart Pattern |
|
|
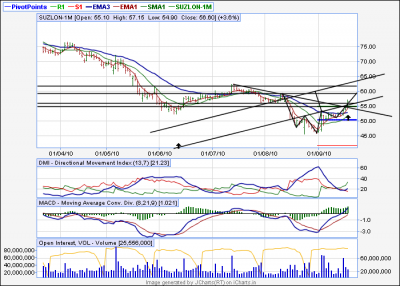
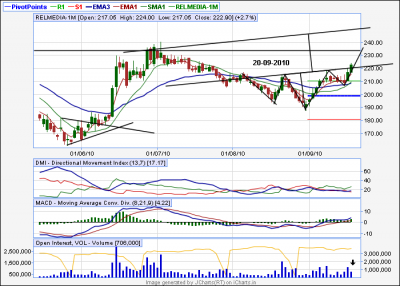
here are some hs patterns that completed the patterns on daily chart. volume analysis at head and shoulders give the strength to the pattern. while suzlon is more promising, the volumes on break of neck line in relmedia is not as great. let us see what will happen, further the pattern in suzlon formed at the, end of fall while the relmedia forming its pattern at some what sideways movement and at the end of current downward move. i do not know the relevence, however....
| Description: |
|
| Filesize: |
42.9 KB |
| Viewed: |
586 Time(s) |
|
| Description: |
|
| Filesize: |
37.49 KB |
| Viewed: |
579 Time(s) |
|
| Description: |
|
| Filesize: |
37.61 KB |
| Viewed: |
530 Time(s) |
|
|
|
| Back to top |
|
|
Padkondu
White Belt
Joined: 23 Jan 2008
Posts: 120
|
| Post: #7 Posted: Sun Oct 31, 2010 12:38 pm Post subject: Goal Style and Strategy |
|
|
As clear from the title of this thread, this is meant for the beginners to gain knowledge and experts to assist the beginner by giving their views and suggestions. i now present an article from my collection for the beginners to begin/rethink all over again from the beginning from basics.
Arthur Hill On Goals, Style and Strategy
Before investing or trading, it is important to develop a strategy or game plan that is consistent with your goals and style. The ultimate goal is to make money (win), but there are many different methods to go about it.
As with many aspects of trading, many sports offer a good analogy. A football team with goals geared towards ball control and low-scoring games might adapt a conservative style that focuses on the run. Teams that want to score often and score quickly are more likely to pursue an aggressive style geared towards passing. Teams are usually aware of their goal and style before they develop a game plan. Investors and traders can also benefit by keeping in mind their goals and style when developing a strategy.
Goals
First and foremost are goals. The first set of questions regarding goals should center on risk and return. One cannot consider return without weighing risk. It is akin to counting your chickens before they are hatched. Risk and return are highly correlated. The higher the potential return, the higher the potential risk. At one end of the spectrum are US Treasury bonds, which offer the lowest risk (so-called risk free rate) and a guaranteed return. For stocks, the highest potential returns (and risk) center on growth industries with stock prices that exhibit high volatility and high price multiples (PE, Price/Sales, Price/Hope). The lowest potential returns (and risk) come from stocks in mature industries with stock prices that exhibit relatively low volatility and low price multiples.
Style
After your goals have been established, it is time to develop or choose a style that is consistent with achieving those goals. The expected return and desired risk will affect your trading or investing style. If your goal is income and safety, buying or selling at extreme levels (overbought/oversold) is an unlikely style. If your goals center on quick profits, high returns and high risk, then bottom picking strategies and gap trading may be your style. Styles range from aggressive day traders looking to scalp 1/4-1/2 point gains to investors looking to capitalize on long-term macro economic trends. In between, there are a whole host of possible combinations including swing traders, position traders, aggressive growth investors, value investors and contrarians. Swing traders might look for 1-5 day trades, position traders for 1-8 week trades and value investors for 1-2 year trades.
Not only will your style depend on your goals, but also on your level of commitment. Day traders are likely to pursue an aggressive style with high activity levels. The goals would be focused on quick trades, small profits and very tight stop-loss levels. Intraday charts would be used to provide timely entry and exit points. A high level of commitment, focus and energy would be required. On the other hand, position traders are likely to use daily end-of-day charts and pursue 1-8 week price movements. The goal would be focused on short to intermediate price movements and the level of commitment, while still substantial, would be less than a day trader. Make sure your level of commitment jibes with your trading style. The more trading involved, the higher the level of commitment.
Strategy
Once the goals have been set and preferred style adopted, it is time to develop a strategy. This strategy would be based on your return/risk preferences, trading/investing style and commitment level. Because there are many potential trading and investing strategies, I am going to focus on one hypothetical strategy as an example.
An example basing on the above guide lines: There are lot of variations where in one can choose from. The following example though not ultimate or unique, can help one setting up their goal, style and strategy.
Example (a) My life style does not permit me sit before the computer all the time and I prefer my trading to be part time activity so that I can pursue other interests/activities such as taking care of my job/other businesses and my family. Neither do my age or health conditions permit me trading aggressively and put lot of effort and concentration on trading nor do I wish making a living on trading as I already have other sources of money for my living. I wish to set aside some capital for trading from which I can get some additional income on trading. Taking into consideration of the above I am now set to set my goal/style and strategy under the above guidelines.
GOAL: First, the goal would be a 20-30% annual return. This is quite high and would involve a correspondingly high level of risk. Because of the associated risk, I would only allot a small percentage (5-10%) of my portfolio to this strategy. The remaining portion would go towards a more conservative approach.
STYLE: Although I like to follow the market throughout the day, I cannot make the commitment to day trading and use of intraday charts. I would pursue a position trading style and look for 1-8 week price movements based on end-of-day charts. Indicators will be limited to three with price action (candlesticks) and chart patterns will carry the most influence.
Part of this style would involve a strict money management scheme that would limit losses by imposing a stop-loss immediately after a trade is initiated. An exit strategy must be in place before the trade is initiated. As such despite taking up some stop loss strategies I shall never loose more than 2.5% of the total trading capital on each trade the price moves against my trade. Should the trade become a winner, the exit strategy would be revised to lock in gains. The maximum allowed per trade would be 5% of my total trading capital. If my total portfolio were 3,00,000, then I might allocate 21,000 (7%) to the trading portfolio. Of this 21,000, the maximum allowed per trade would be 1050 (21,000 * 5%).
STRATEGY: (a) Support/Resistance Strategy: The time frame that meets my goals and style is short term positional trading on daily charts: The trading strategy is to go long stocks that are near support levels and short stocks near resistance levels. (i) To maintain prudence, I would only seek long positions in stocks with weekly (long-term) bull trends and short positions in stocks with weekly (long-term) bear trends. (ii) In addition, I would look for stocks that are starting to show positive (or negative) divergences in key momentum indicators as well as signs of accumulation (or distribution). My indicator arsenal would consist of two momentum indicators (PPO and Slow Stochastic Oscillator) and one volume indicator (Accumulation/Distribution Line). Even though the PPO and the Slow Stochastic Oscillator are momentum oscillators, one is geared towards the direction of momentum (PPO) and the other towards identifying overbought and oversold levels (Slow Stochastic Oscillator). As triggers, I would use key candlestick patterns, price reversals, chart patterns and gaps to enter a trade.
This is just one hypothetical strategy that combines goals with style and commitment. Some people have different portfolios that represent different goals, styles and strategies. While this can become confusing and quite time consuming, separate portfolios ensure that investment activities pursue a different strategy than trading activities. For instance, you may pursue an aggressive (high-risk) strategy for trading with a small portion of your portfolio and a relatively conservative (capital preservation) strategy for investing with the bulk of your portfolio. If a small percentage (~5-10%) is earmarked for trading and the bulk (~90-95%) for investing, the equity swings should be lower and the emotional strains less. However, if too much of a portfolio (~50-60%) is at risk through aggressive trading, the equity swings and the emotional strain could be large.
|
|
| Back to top |
|
|
kaisarimam96
White Belt
Joined: 18 Nov 2009
Posts: 6
|
| Post: #8 Posted: Sun Oct 31, 2010 7:34 pm Post subject: Trading Indicators and Strategy |
|
|
I am not expert but would like to present my view as i do want to learn from others.
1. One strategy of trading which is giving profit in one market condition
e.g.- trending market may not be giving profit in another market conditions like sideways market. If you see history market is trending in
20-25 percent of times and moves in sideways in 80-75 percent times.
So over the period of time you need strategy which gives profit in sidewasy market. Mean to say you can get profitable trades in most of market situation.
2. There is no holy grail of trading or there is no strategy which is profitable in all types of markt . Remember i am talking about stretegie
based upon indicators.
3. As per my personal views indicator based trading is dead now and the only way to make profit in all types of market is Price action based trading
. In this trading strategy you do not have any indicator or moving average on chart but one clear and clean chart and you take trades on the basis of price actions.
4. time frame i feel if you go for timeframe lesser than 20 minutes there is lot of noise in market so one should choose to trade time frame 20 minutes or above. whatever you choose stick to it and forget what chart is telling in daily chart. You must determine your trading target and stoploss as per your trading time frame and stick to it. Remember nobody is wrong or right but one should be consistent.
5. In my next post i will try to post some trades i did on the basis of price action and how profitable it was.
|
|
| Back to top |
|
|
Padkondu
White Belt
Joined: 23 Jan 2008
Posts: 120
|
| Post: #9 Posted: Tue Nov 02, 2010 8:40 am Post subject: Re: Trading Indicators and Strategy |
|
|
Dear kaisarimam96!
Thanks for your response. I heartfully invite your suggestions to the beginners in this forum and request yo to keep following this thread.
i would like to explain that the objective of the article i presented here is not about a "trading strategy" or a "holygrail". i wanted to go step by step and this is the first, basic step towards trading, to understand about the Goals -> Style -> Strategy. to know about what you expect from the market - the objective/goal, then decide the style (long term/short term/swingtrade/daytrade) and then choose the pertinent timeframe. then adopt a strategy that is suitable to your style. that is the centre idea of this article.
one needs to have two strategies, one to handle the trending markets and the other to handle the trading/sideways market. first of all to one should know "where are we in the master chart", the methods of identifying trend and know if we are in a trending or sidewasy market. then go about strategies. this is my plan.
is it not true that most of the beginners are not clear about their goals/style/objectives. there are several people who are trading wrong time frame/wrong style -in the context of their age/psychology/investment pattern. the problem here is most of us as beginners follow some body or take the advice of an expert for whome the above perameters are not the same. i have one friend who frequently changes his timeframe and feel difficulties despite years of market experince. there is another who puts lot of money into his trading account and focusses only on day trading - loosing very good investment opportunities/positional ST Trades. he is good at day trading and trades huge quantities, but at the end of the day the ROI (Return on investment) is not so great because there is lot of money un used. if he were paying little attention on positional trading,the final results may be on par with his day trading and even more with comparitively less effort/strain.
In choosing a style one has to consider (i) the money he wants to put in trading.(ii) the time and effort he can take. (ii) importantly his psychology. these are all different for different people, and it is for them to decide.
there are some who trade with out thinking into these aspects.
i was one among these an year ago. if this article could make them re think the issue, that is enough.
one more thing is that, as evident form the title of the thread, it is for the beginners to understand the complex dynamics of the market/ complex market psychology/tuning ones own mind towards trading in an unbiassed/desciplined way - OR - for the experts to guide the beginners regading these matters.
Regards
padkondu
Last edited by Padkondu on Wed Dec 15, 2010 9:53 pm; edited 1 time in total |
|
| Back to top |
|
|
Padkondu
White Belt
Joined: 23 Jan 2008
Posts: 120
|
| Post: #10 Posted: Wed Dec 15, 2010 9:04 pm Post subject: Understanding ADX/DMI - Identification of Trend |
|
|
Hi firiends.
those who want to know ADX/DMI interpretation, identify whether there is a trend or not - Pl go thro da doc file.
Regards
Padkondu
| Description: |
|

Download |
| Filename: |
ADX DMI.doc |
| Filesize: |
93.5 KB |
| Downloaded: |
1568 Time(s) |
|
|
| Back to top |
|
|
Padkondu
White Belt
Joined: 23 Jan 2008
Posts: 120
|
| Post: #11 Posted: Sat Dec 18, 2010 6:48 pm Post subject: Day trading strategy |
|
|
Dear kumudranjan,
here i explain the strategy i duscussed in the sb.
the basic idea of the strategy is to trade along the very short trend on a pull back. just like any other strategy there are advantages and disadvantages with this strategy.
advantages: Very simeple, more probable and less wipsaws. good success rate.
disadvantages: u can not capture some good moves. u will miss them. how ever i will let u know to tune this so that u can expand it to more number of trades. Less profit on each trade most of the time when market is not moving anywhere. less number of trades per day.
Chart set up.
timeframe: 5 min.
Moving averages: 107EMA and 200SMA. u can test this with other combinations after getting some success in this system and some experience. (alternatively u can use 34EMA & 89SMA setup for more number of entries and exits)
lower indicators:
BOS(9), CCI(3).
Long Entry:107RMA and 200SMA is showing an up trend in place. tha is, 107EMA is above 200SMA and sufficiently far apart. also the stock is trading below these moving averages.
BOS(9) has move upto -1 or -2 and just reversed and mean while the CCI(3) has touched -100 and crossed 0. enter on open of the next candle.
Long Exit: open a live chart (5min) and set up SMA(5,Low). this gives the stop and exit on cloe of the candle below SMA(5.Low).
Short Entry: 107EMA and 200SMA set up is showing the down trend, that is 107EMA is below 200SMA and also the stock is trading belwo the set up.
BOS(9) has moved above +1 or +2 and just reversed and mean while CCI(3) has touched +100 and Crossed 0-line.
Short Exit: open live charts(5Min) and set up SMA(5,High). exit on close of the stock above SMA(5,High).
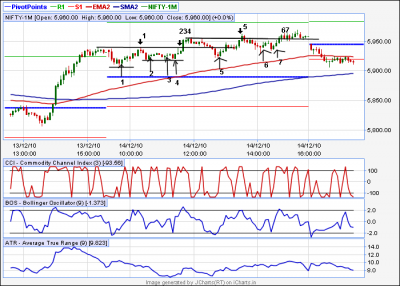
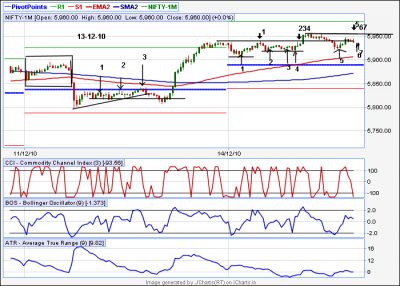
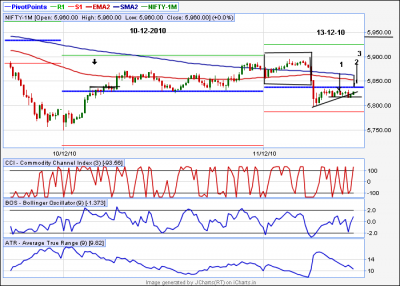
now here with i gave 6 days charts for which entries are marked and in most of the case the trade ended in some profit. but there will be one day in a week where u make huge profit.
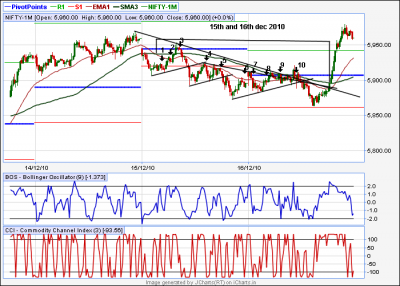
| Description: |
| now the shorts have ended and time for longs 1st and 4th gave good returns while 2nd and 3rd have ended with marginal returns |
|
| Filesize: |
34.11 KB |
| Viewed: |
567 Time(s) |
|
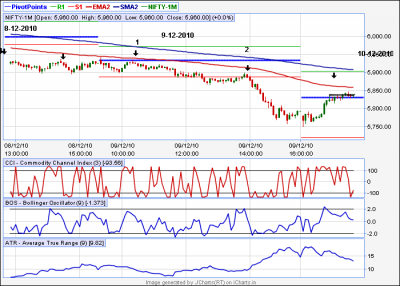
| Description: |
| normally i would not have taken thefirst two signals as they are very close to moving averages but the third one i take because of probalility of getting resistance at pivot and bos has touched +2 and reversed. also note that reversal of bos form +2 is st |
|
| Filesize: |
32.4 KB |
| Viewed: |
538 Time(s) |
|
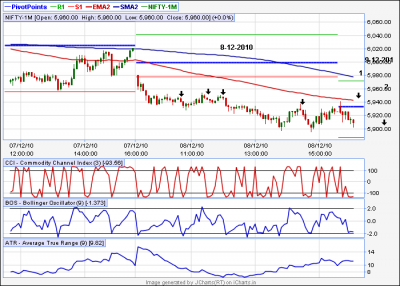
| Description: |
| there is only one entry on this day, stock crossed pivot line and close to MA set up |
|
| Filesize: |
32.38 KB |
| Viewed: |
542 Time(s) |
|
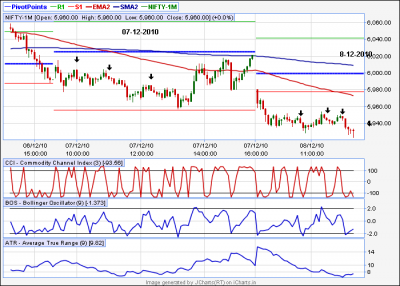
| Description: |
| this is the one day in a week i said, u can make good profit on this day |
|
| Filesize: |
32.98 KB |
| Viewed: |
539 Time(s) |
|
| Description: |
| first two trades ened with very less profit or negligible loss but the third and fourth trades gave some good profit |
|
| Filesize: |
33.9 KB |
| Viewed: |
516 Time(s) |
|
| Description: |
| there are two trades on this day, ignore the first short i indicated. |
|
| Filesize: |
33.77 KB |
| Viewed: |
520 Time(s) |
|
|
|
| Back to top |
|
|
Padkondu
White Belt
Joined: 23 Jan 2008
Posts: 120
|
| Post: #12 Posted: Sat Dec 18, 2010 6:53 pm Post subject: Re: Day trading strategy |
|
|
Dear kumudranjan
also back test this set up with 34EMA and 89SMA. actually i do not day trade. i use this with totally different parameters on 15 min chart for swing trading.
Regards
Padkondu.
|
|
| Back to top |
|
|
Padkondu
White Belt
Joined: 23 Jan 2008
Posts: 120
|
| Post: #13 Posted: Sat Dec 18, 2010 7:12 pm Post subject: Re: Day trading strategy |
|
|
dear Kumudranjan
here we go with 34ema and 89sma set up and see more wipsaws and more entries. in the chart below, i take signal 1 which ened in a loss. i ignore signal 2 and signal 3. but it makes sense to take 3rd signal since it might find resistance at pvt line. 4th and 5th are also taken since after corssing s1 they migh face resistance at s1 line. i ignore 6th signal as the market neared closing. i took 8th and 9th may be due to shorting tendncy of the last few days or they are at resistance of pivot line. 10th i ignored since previous candle cloed above pivot line but i entered on the breach of previous trend line which gave some good returns.
regards
padkondu.
| Description: |
| find that u get more wipsawas and more confusion more analysys is required. |
|
| Filesize: |
46.3 KB |
| Viewed: |
544 Time(s) |
|
|
|
| Back to top |
|
|
casper
Green Belt

Joined: 02 Oct 2010
Posts: 1315
|
| Post: #14 Posted: Sat Dec 18, 2010 8:33 pm Post subject: Re: Day trading strategy |
|
|
| Padkondu wrote: | dear Kumudranjan
here we go with 34ema and 89sma set up and see more wipsaws and more entries. in the chart below, i take signal 1 which ened in a loss. i ignore signal 2 and signal 3. but it makes sense to take 3rd signal since it might find resistance at pvt line. 4th and 5th are also taken since after corssing s1 they migh face resistance at s1 line. i ignore 6th signal as the market neared closing. i took 8th and 9th may be due to shorting tendncy of the last few days or they are at resistance of pivot line. 10th i ignored since previous candle cloed above pivot line but i entered on the breach of previous trend line which gave some good returns.
regards
padkondu. |
dear padkondu, at first i must thank u for ur effort that you are trying ur best to solve the problems which may be faced by the freshers, moreover, u r almost doing its single handedly. its very commendable thing
if u permit me, may i suggest u a few things?
plz trade in 60 min tf and whenever u see a 34/89 ema crossover, try to validate that from macd. our jcharts produce nice buy/sell signals
i have seen that in trending market, if we trade in 60 min tf and if we try to validate (like a sell signal for a negative cross over, and a buy signal for a positive cross over ) ema crossover with macd, we can gain virtually limitlessly in swing trading
it is also advisable to add dmi indicator to judge the strength of trend along with macd
wishing u a lot of success
casper
|
|
| Back to top |
|
|
Padkondu
White Belt
Joined: 23 Jan 2008
Posts: 120
|
| Post: #15 Posted: Sat Dec 18, 2010 8:55 pm Post subject: Re: Day trading strategy |
|
|
Dear Casper,
Thank you for your encouragement. actually, i too have been a looser because of lack of technical knowledge. i am still a novice trader, only the difference is i used prudent money management now a days. as such i keep continuing in the market. but i have a long road to go to achieve my goals. i am yet to recover the losses i made a couple of years back, during the mega fall. only after hits i seriously started learning.
now i have a question.
i primarily swing trade stocks using daily+hourly charts. but i feel i did not get the grip. may be because daily chart is 6 times the hourly chart, particularly after increase in the market hours. too much gap in a multiple trading system. i can not go for lesser timeframes because of some constraints like time and effort. it would be great if we could have 4-hours time frame. how do i over come this? what setup can i use in this system. also please let me know what levels are important in swing trading? i use fibo retracements on daily/weekly charts and weekly pivots. is that sufficient. i also use key moving averages such as 21,30,50,89 and 150, 200 day moving averages. please advice.
regards
padkondu
|
|
| Back to top |
|
|
|
|
You cannot post new topics in this forum
You cannot reply to topics in this forum
You cannot edit your posts in this forum
You cannot delete your posts in this forum
You cannot vote in polls in this forum
You can attach files in this forum
You can download files in this forum
|
Powered by phpBB © 2001, 2005 phpBB Group
|
|
|


