| View previous topic :: View next topic |
| Author |
Trading example-illustrating my strategy |
pradeepgolfer
White Belt

Joined: 16 Sep 2009
Posts: 212
|
Post: #1  Posted: Mon Aug 02, 2010 8:39 am Post subject: Trading example-illustrating my strategy Posted: Mon Aug 02, 2010 8:39 am Post subject: Trading example-illustrating my strategy |
 |
|
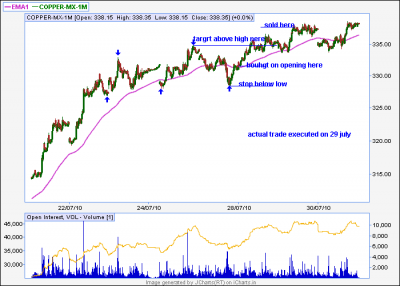
This is an actual trade.
The up arrows indicate higher lows (HL). The down arrows indicate higher highs.
The chart should be self explanatory.Please post your questions.
The idea is see it and trade it.If you can't see anything do not trade.
Too many people go to great analytical lengths to find a trade. If market is complicated do not trade-complicated markets makes losing money simple.
If someone is troublesome what to do? Simple ! Avoid him.
Ed Seykota "Until you master the basic literature and spend some time with successful traders, you might consider confining your trading to the supermarket"
| Description: |
| copper 5 min chart with 240 period MA |
|
| Filesize: |
16.18 KB |
| Viewed: |
856 Time(s) |
|
|
|
| Back to top |
|
 |
|
|
 |
pradeepgolfer
White Belt

Joined: 16 Sep 2009
Posts: 212
|
Post: #2  Posted: Mon Aug 02, 2010 9:47 am Post subject: Why I sold there Posted: Mon Aug 02, 2010 9:47 am Post subject: Why I sold there |
 |
|
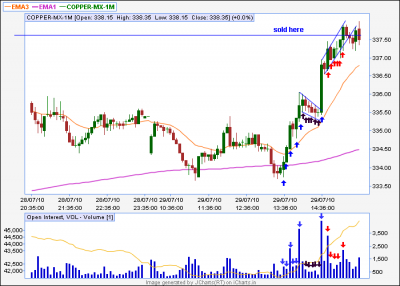
I am going to explain why did I sell when I did.
I have marked some bars with blue arrows.Note the bars do not overlap each other.If you look to the corressponding volume-which is also marked with blue arrows- notice it is higher than the period which precedes the blue marked volume bars.
The bars which are marked dark brown-is a pause in the uptrend.Why? Look at the volume bars marked dark brown-these volume bars are very much lower than the blue volume bars.This shows not many people are interested in selling-certainly not the operator.
The single blue arrow which follows the brown arrows marks a bar with an explosive increase of range-it is much bigger than any of the up bars which preceded it in the swing-and also of volume.This shows traders have realised that copper is going up.
The bars marked in red arrows marks an 'uptrend' but notice there is a lot of overlap of bars.The corresponding volume bars-which are marked in red arrows-are much higher than the volume bars which are marked by the blue and dark brown arrows.This makes it clear operator is selling.What does a trader do if operator is selling?If anybody knows please tell me!!!!
| Description: |
|
| Filesize: |
17.96 KB |
| Viewed: |
825 Time(s) |
|
|
|
| Back to top |
|
 |
t.chatterjee
White Belt

Joined: 07 May 2010
Posts: 66
|
Post: #3  Posted: Mon Aug 02, 2010 11:32 am Post subject: Posted: Mon Aug 02, 2010 11:32 am Post subject: |
 |
|
To save my skin i wud sell wid the operator  or else wud get doomed..... or else wud get doomed..... 
|
|
| Back to top |
|
 |
pradeepgolfer
White Belt

Joined: 16 Sep 2009
Posts: 212
|
Post: #4  Posted: Mon Aug 02, 2010 12:20 pm Post subject: Posted: Mon Aug 02, 2010 12:20 pm Post subject: |
 |
|
chatterjee

|
|
| Back to top |
|
 |
pradeepgolfer
White Belt

Joined: 16 Sep 2009
Posts: 212
|
Post: #5  Posted: Mon Aug 02, 2010 1:38 pm Post subject: You cannot decide the target in advance Posted: Mon Aug 02, 2010 1:38 pm Post subject: You cannot decide the target in advance |
 |
|
You cannot decide the target. That the market will do. You are the passenger,not the driver.If the train you are in is going to Delhi but it turns around and starts to go towards Bangaleru.Now everybody will insist the train is going to Delhi.You can see it is going to Bangaleru.There is only one thing to do:GET OUT.
I did not know I was going to sell at that level when I entered the position but the market action- price volume action-indicated it was time to book profit
|
|
| Back to top |
|
 |
vinst
Black Belt

Joined: 09 Jan 2007
Posts: 3303
|
Post: #6  Posted: Mon Aug 02, 2010 1:51 pm Post subject: Posted: Mon Aug 02, 2010 1:51 pm Post subject: |
 |
|
Pradeep,
thanks a lot for posting good example! Will definitely look for more learning through your example trades.
regards
vin
|
|
| Back to top |
|
 |
shekharinvest
Yellow Belt

Joined: 21 Dec 2007
Posts: 549
|
Post: #7  Posted: Mon Aug 02, 2010 3:23 pm Post subject: Posted: Mon Aug 02, 2010 3:23 pm Post subject: |
 |
|
Pradeep,
You have nicely explianed the sell.
I could not get your buy, where did you buy and more so why did you buy there.
I presume you bought after the close of first green candle.
A higher low in itself is not a sufficient reason to buy I beleive.
SHEKHAR
NB: One request if you could post all your veiws on this strategy in one thread it would be quite convenient to follow.
|
|
| Back to top |
|
 |
pradeepgolfer
White Belt

Joined: 16 Sep 2009
Posts: 212
|
Post: #8  Posted: Mon Aug 02, 2010 4:59 pm Post subject: Posted: Mon Aug 02, 2010 4:59 pm Post subject: |
 |
|
Shekharinvest
If you scroll down you will find the post'trading example illustrating my strategy'.
In that chart you will four blue arrows - two up and two down - on the left side.Those arrows mark higher highs and higher lows. There were two higher highs and two higher lows before the position was taken.The HH AND HL s indicated an uptrend and so the intention was to go ( long ) with the trend.
I hope that makes it clear why the buy was made.
|
|
| Back to top |
|
 |
pradeepgolfer
White Belt

Joined: 16 Sep 2009
Posts: 212
|
Post: #9  Posted: Mon Aug 02, 2010 5:14 pm Post subject: Posted: Mon Aug 02, 2010 5:14 pm Post subject: |
 |
|
Shekharinvest
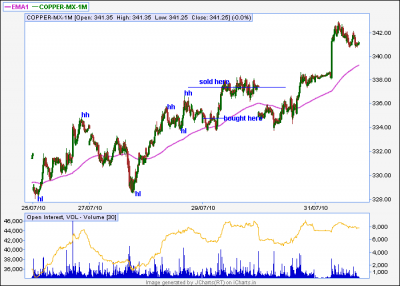
I have posted a new chart wherein a number of higher highs and higher lows were made before a buy was made.I hope this helps.
| Description: |
|
| Filesize: |
17.77 KB |
| Viewed: |
644 Time(s) |
|
|
|
| Back to top |
|
 |
shekharinvest
Yellow Belt

Joined: 21 Dec 2007
Posts: 549
|
Post: #10  Posted: Mon Aug 02, 2010 7:49 pm Post subject: Posted: Mon Aug 02, 2010 7:49 pm Post subject: |
 |
|
| pradeepgolfer wrote: | Shekharinvest
I have posted a new chart wherein a number of higher highs and higher lows were made before a buy was made.I hope this helps. |
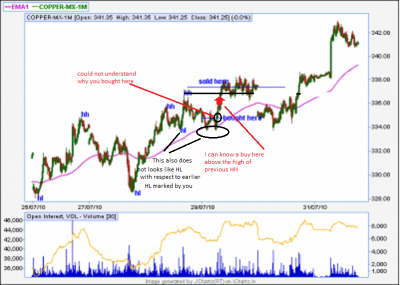
Sorry, I still could not get where did you took that entry & WHY ?
SHEKHAR
| Description: |
|
| Filesize: |
226.14 KB |
| Viewed: |
618 Time(s) |
|
|
|
| Back to top |
|
 |
pradeepgolfer
White Belt

Joined: 16 Sep 2009
Posts: 212
|
Post: #11  Posted: Tue Aug 03, 2010 5:13 am Post subject: I admire your frankness,your persistance,desire to learn Posted: Tue Aug 03, 2010 5:13 am Post subject: I admire your frankness,your persistance,desire to learn |
 |
|
Dear Shekhar
I admire your frankness,your persistance,your desire to learn and above all for taking advantage of an opportunity to benefit from a trader more experienced than yourself.Many good traders do not or cannot explain what they do and why.This is not a fault but not everyone can be a good or eager teacher.Most novices do not make enough effort to learn.
A decision to make a trade cannot be made because of only one reason or two.This because for a trade to be successful you have to right twice-when you enter and when you exit.Also you are fighting a number of strong enemies-big players,operators who have considerable power and Time itself.
First the background to the trade.For eight days in a row copper has not broken the previous day's low.Do NOT yield to the temptation to believe that it has gone up for eight days in a row and therefore a down day or two, is inevitable.I remember, in 2006, ACC went up for 30 trading sessions in a row without once breaking the previous days low.This observation decides two things for the trader.One the trend is up and strongly up and only long trades are to be taken.Two it decides the stop loss.Which should be below the previous day's low.
THIS WILL BE CONTINUED IN THE NEXT POST I THINK THERE IS A LIMIT ON SIZE OF POST
|
|
| Back to top |
|
 |
pradeepgolfer
White Belt

Joined: 16 Sep 2009
Posts: 212
|
Post: #12  Posted: Tue Aug 03, 2010 6:17 am Post subject: admire your frankness,your persistance,desire to learn cont. Posted: Tue Aug 03, 2010 6:17 am Post subject: admire your frankness,your persistance,desire to learn cont. |
 |
|
These two are the most crucial foundation for a trade-the trend and the stop.If these two are not clear do not trade.Too many traders spend hours analysing a stock or market using all kinds of methods such as elliot wave Demark indicators fibanacci numbers.If you cannot SEE the trend and stop in a few minutes do not trade.
If market is complicated do not trade.Complicated markets make losing money simple.If somebody is troublesome avoid him.Trade on your terms not the operator's.
See it and trade it. Cannot see it,see a movie instead.Or post something useful for others
Since the trend on the daily is up check the intraday charts for an entry.
THIS WILL CONTINUE IN THE NEW POST
Last edited by pradeepgolfer on Thu Aug 05, 2010 3:02 pm; edited 2 times in total |
|
| Back to top |
|
 |
pradeepgolfer
White Belt

Joined: 16 Sep 2009
Posts: 212
|
Post: #13  Posted: Tue Aug 03, 2010 6:18 am Post subject: Posted: Tue Aug 03, 2010 6:18 am Post subject: |
 |
|
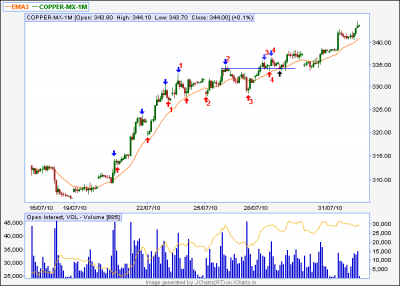
The chart below is of the 60 min copper with a 20 ma.The red arrows mark higher lows, the blue arrows mark higher highs and the black arrow is the buying point. Red numbers mark the swings- 11, 22, 33 44.ALL the swings formed higher highs and higher lows.Also notice that the lenght or size of the downmove after swings 11 and 22 tested the low point of the swing.Now notice the lenght of the downmove after swing 33.The consolidation after swing 33 was very tight and not downward but horizontalThis indicated selling pressure has now disappeared.A tight consolidation took place for nine hours above the swing high of swing 2.
All these were the reasons for taking the trade.Reasons should be based on market structure and not on any trader's intuition.
While an attempt can be made to fine tune the entry further, do not attempt to aim for perfection.I am quite happy to accept what the market is kind enough to give me.I am free to refuse that and wait for a better offer.And most times I do that.
If you have any doubts or questions please feel free to contact me.
| Description: |
|
| Filesize: |
16.47 KB |
| Viewed: |
563 Time(s) |
|
|
|
| Back to top |
|
 |
pradeepgolfer
White Belt

Joined: 16 Sep 2009
Posts: 212
|
Post: #14  Posted: Tue Aug 03, 2010 7:15 am Post subject: DEFINITION OF Higher Highs AND Higher Lows Posted: Tue Aug 03, 2010 7:15 am Post subject: DEFINITION OF Higher Highs AND Higher Lows |
 |
|
| You may be wondering how to spot higher highs and higher lows.Do not search for exact definitions:markets are not perfect and they often are highly emotional which makes for very confusing structure.Operators take advantage of illiquid periods to influence or manufacture wild volatility which will confuse indicators, trigger stops and break high or lows by minor amounts.Experience will show you when to recognise these false but dramatic moves.However remember that to maufacture such gyrations the operator has to incur a cost.Which is why such moves will break important levels by minor amounts only,in order to to trap trigger happy or emotional or nervous traders.The important thing is to observe if you can a recognise a broad uni-directional movement.That is the first thing to do.If there is such a structure look more closely and see if you can find some hh and hl s. These also need not be perfect-it can be violated by 3-4 ticks.Some stocks are more well behaved than others.Natural gas is not behaved at all and it requires huge stops.If you can see a trend then locate the stop.I say locate the stop, not decide the stop because the stop has to be below a point to be decided by market structure and not by what amount you want to lose or risk. If the risk is too high or clarity is not there do not trade
|
|
| Back to top |
|
 |
sumesh_sol
Brown Belt

Joined: 06 Jun 2010
Posts: 2344
|
Post: #15  Posted: Tue Aug 03, 2010 12:31 pm Post subject: HDFC BANK (hourly) Posted: Tue Aug 03, 2010 12:31 pm Post subject: HDFC BANK (hourly) |
 |
|
Hi Pradeep,
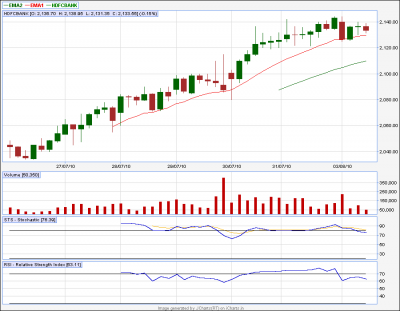
Please see and give your comments. Can we short it?
Regards,
Sumesh
| Description: |
|
| Filesize: |
14.27 KB |
| Viewed: |
529 Time(s) |
|
|
|
| Back to top |
|
 |
|

