| View previous topic :: View next topic |
| Did you find this one interesting ? |
| Yes |
|
90% |
[ 45 ] |
| No |
|
10% |
[ 5 ] |
|
| Total Votes : 50 |
|
| Author |
Trading Gartleys |
chiragbvyas
White Belt

Joined: 18 Feb 2010
Posts: 469
|
Post: #31  Posted: Sun Feb 13, 2011 11:38 am Post subject: what are the levels ? Posted: Sun Feb 13, 2011 11:38 am Post subject: what are the levels ? |
 |
|
| shekharinvest wrote: | Here is one more attempt on Gartleys.
The following was observed a few days back hence chart is an old one.
Nifty weekly chart.
X= 4786
A= 6339
B= 5690
C=6181
D = ??? (MAX 78.6% OF X-A = 1220 NS LEVEL 5119)
X-A = 1553
A-B = 649 (MIN 38.2% X-A = 593) DONE 649 ABOUT 41%
C -D = ??
Although AB is not equal to CD in this case
So long as 5119 holds. Target should be 6700 approx.
SHEKHAR |
|
|
| Back to top |
|
 |
|
|
|
ashis
White Belt
Joined: 28 Mar 2010
Posts: 75
|
| Post: #32 Posted: Mon Feb 14, 2011 9:40 am Post subject: |
|
|
Dear sir,
On 21st Jan, 2011 we calculated X=5349
and on 13th Feb we calculated X=4786.
So can you update us that how can we decide about this perfact X-Value?
Regards
Ashis
| shekharinvest wrote: | Here is one more attempt on Gartleys.
The following was observed a few days back hence chart is an old one.
Nifty weekly chart.
X= 4786
A= 6339
B= 5690
C=6181
D = ??? (MAX 78.6% OF X-A = 1220 NS LEVEL 5119)
X-A = 1553
A-B = 649 (MIN 38.2% X-A = 593) DONE 649 ABOUT 41%
C -D = ??
Although AB is not equal to CD in this case
So long as 5119 holds. Target should be 6700 approx.
SHEKHAR |
|
|
| Back to top |
|
|
shekharinvest
Yellow Belt

Joined: 21 Dec 2007
Posts: 549
|
| Post: #33 Posted: Mon Feb 14, 2011 12:34 pm Post subject: |
|
|
| ashis wrote: | Dear sir,
On 21st Jan, 2011 we calculated X=5349
and on 13th Feb we calculated X=4786.
So can you update us that how can we decide about this perfact X-Value?
Regards
Ashis
|
Ashis
X is not some calculated value. It is a presumed starting point of the Pattern, based on the visibility of the pattern to the naked eye.
All calculation are based on the presumption that gartley pattern started at 4786.
Your guess could be as good as mine.
SHEKHAR
|
|
| Back to top |
|
|
shekharinvest
Yellow Belt
Joined: 21 Dec 2007
Posts: 549
|
| Post: #34 Posted: Mon Feb 14, 2011 1:22 pm Post subject: |
|
|
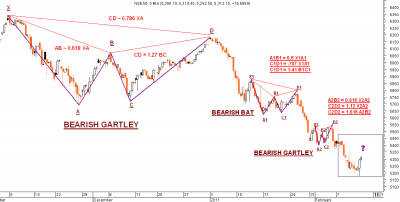
Posted below is a chart with some interesting observations.
Credit goes to forum member Fire at some other blog.
SHEKHAR
| Description: |
|
| Filesize: |
152.94 KB |
| Viewed: |
681 Time(s) |
|
|
|
| Back to top |
|
|
vinst
Black Belt

Joined: 09 Jan 2007
Posts: 3303
|
| Post: #35 Posted: Tue Feb 15, 2011 9:10 am Post subject: |
|
|
| shekharinvest wrote: | Posted below is a chart with some interesting observations.
Credit goes to forum member Fire at some other blog.
SHEKHAR |
Shekhar,
thanks a lot for posting this. Is the time frame 4 hr bars? It didin't look like daily.
regards
vin
|
|
| Back to top |
|
|
shekharinvest
Yellow Belt
Joined: 21 Dec 2007
Posts: 549
|
| Post: #36 Posted: Tue Feb 15, 2011 12:25 pm Post subject: |
|
|
| vinst wrote: | | shekharinvest wrote: | Posted below is a chart with some interesting observations.
Credit goes to forum member Fire at some other blog.
SHEKHAR |
Shekhar,
thanks a lot for posting this. Is the time frame 4 hr bars? It didin't look like daily.
regards
vin |
Vinst
This is indeed an intra chart. I thought it to be hrly chart, since have no access to intra charts could not confirm it.
Shall revert if I get to know from Fire.
SHEKHAR
|
|
| Back to top |
|
|
vinst
Black Belt
Joined: 09 Jan 2007
Posts: 3303
|
| Post: #37 Posted: Tue Feb 15, 2011 12:37 pm Post subject: |
|
|
| shekharinvest wrote: | | vinst wrote: | | shekharinvest wrote: | Posted below is a chart with some interesting observations.
Credit goes to forum member Fire at some other blog.
SHEKHAR |
Shekhar,
thanks a lot for posting this. Is the time frame 4 hr bars? It didin't look like daily.
regards
vin |
Vinst
This is indeed an intra chart. I thought it to be hrly chart, since have no access to intra charts could not confirm it.
Shall revert if I get to know from Fire.
SHEKHAR |
the time axis showed a time span of more than 2 months, 1 hr chart wud have been very crowded. that's why i thought 4 hr may be.
regards
vin
|
|
| Back to top |
|
|
shekharinvest
Yellow Belt
Joined: 21 Dec 2007
Posts: 549
|
| Post: #38 Posted: Tue Feb 15, 2011 12:51 pm Post subject: |
|
|
| vinst wrote: | | shekharinvest wrote: | | vinst wrote: | | shekharinvest wrote: | Posted below is a chart with some interesting observations.
Credit goes to forum member Fire at some other blog.
SHEKHAR |
Shekhar,
thanks a lot for posting this. Is the time frame 4 hr bars? It didin't look like daily.
regards
vin |
Vinst
This is indeed an intra chart. I thought it to be hrly chart, since have no access to intra charts could not confirm it.
Shall revert if I get to know from Fire.
SHEKHAR |
the time axis showed a time span of more than 2 months, 1 hr chart wud have been very crowded. that's why i thought 4 hr may be.
regards
vin |
Thanks Vinst to pointing out the timeline underneath the charts. I was such a dud ! missed them absolutely.
SHEKHAR
|
|
| Back to top |
|
|
ashis
White Belt
Joined: 28 Mar 2010
Posts: 75
|
| Post: #39 Posted: Sun Feb 20, 2011 10:15 pm Post subject: |
|
|
Sorry chart is not attached but available on 14th February, Blog.
Dear sirji,
Post is great.
I would like to know one thing in this chart that as per Gartly theory we can decide X,A,B,C,D but after D-Value achieved then what will be the level where market will come?
Same things are there after achieving D1 & D2 in this chart.
What is the technique to decide another bottom as per Gartly?
Awaiting for your valuable comment.
Regards
Ashis
| shekharinvest wrote: | Posted below is a chart with some interesting observations.
Credit goes to forum member Fire at some other blog.
SHEKHAR |
|
|
| Back to top |
|
|
shekharinvest
Yellow Belt
Joined: 21 Dec 2007
Posts: 549
|
| Post: #40 Posted: Mon Feb 21, 2011 8:23 am Post subject: |
|
|
| ashis wrote: | Sorry chart is not attached but available on 14th February, Blog.
Dear sirji,
Post is great.
I would like to know one thing in this chart that as per Gartly theory we can decide X,A,B,C,D but after D-Value achieved then what will be the level where market will come?
Same things are there after achieving D1 & D2 in this chart.
What is the technique to decide another bottom as per Gartly?
Awaiting for your valuable comment.
Regards
Ashis
| shekharinvest wrote: | Posted below is a chart with some interesting observations.
Credit goes to forum member Fire at some other blog.
SHEKHAR |
|
Ashis
Gartley pattern is not used for identifying the tops / bottoms of the given move. Infact it is a continuation pattern.
It offers us an opportunity to target a price objective equal to the length of Leg XA once it establishes point D.
SHEKHAR
|
|
| Back to top |
|
|
pattiboy02
White Belt
Joined: 16 Mar 2009
Posts: 220
|
|
| Back to top |
|
|
rohit44
White Belt
Joined: 05 Jan 2010
Posts: 279
|
| Post: #42 Posted: Fri Feb 25, 2011 10:45 am Post subject: |
|
|
| As the gartley is under process....we may see 5550 first then a fall??? fall upto??...please advise.....Rgds....
|
|
| Back to top |
|
|
acharyams
Yellow Belt
Joined: 04 Jul 2010
Posts: 552
|
| Post: #43 Posted: Sun Feb 27, 2011 8:40 pm Post subject: Re: what are the levels ? |
|
|
So long as 5119 holds. Target should be 6700 approx.
SHEKHAR[/quote][/quote]
SIR,
5119 STILL HOLDING. ARE WE ON THE WAY TO 6700?
|
|
| Back to top |
|
|
bassan
White Belt
Joined: 01 Dec 2009
Posts: 57
|
| Post: #44 Posted: Mon Feb 28, 2011 2:01 am Post subject: |
|
|
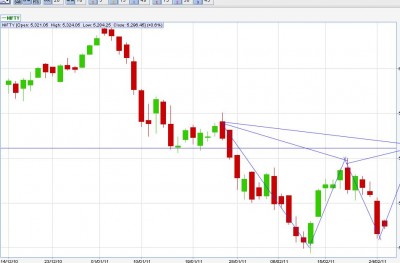
HI Shekar
In the attached chart
X=5802,A=5178,B=5599,C=5233
X-A=624
B-A=421
B-C=366
B=0.618%ofX-A=386. 5178+386=5564(Almost reached)
C=0.786%OfB-C=331. 5599-331=5268(Almost reached)
D=1.27%OfB-C=366. 5233+465=5698.
If market retrace from here then 5700 is the next tgt.
Pls offer your valuable views.
| Description: |
|
| Filesize: |
28.1 KB |
| Viewed: |
506 Time(s) |
|
|
|
| Back to top |
|
|
shekharinvest
Yellow Belt
Joined: 21 Dec 2007
Posts: 549
|
|
| Back to top |
|
|
|