| View previous topic :: View next topic |
| Did you find this one interesting ? |
| Yes |
|
90% |
[ 45 ] |
| No |
|
10% |
[ 5 ] |
|
| Total Votes : 50 |
|
| Author |
Trading Gartleys |
shekharinvest
Yellow Belt

Joined: 21 Dec 2007
Posts: 549
|
Post: #1  Posted: Fri Jan 21, 2011 7:40 pm Post subject: Trading Gartleys Posted: Fri Jan 21, 2011 7:40 pm Post subject: Trading Gartleys |
 |
|
Hi,
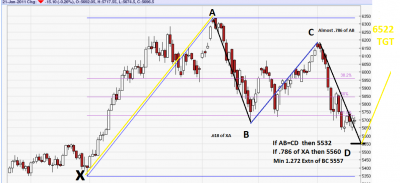
Posted below is a chart of Nifty as it unfolds. It seems that it is making a Gartley pattern. So far symmetry is good. Should it take support at 5530-5560 area and then reverses it can do 6525-6550.
Gartley is a complex price pattern based on Fibonacci numbers/ratios. It is used to determine buy and sell signals by measuring price retracements of a stock's up and down movement in stock price.
X - 5349
A - 6339
B - 5690
C - 6181
D - ??? ( 5532, 5557, 5560)
X-A = 990
A-B = 649
B-C = 491
C-D = ??? ( 649, 624 )
A-B = .618 OF XA
B-C = .786 OF A-B (almost)
C-D min has to be 1.272% of B-C (624) and max it can be 2.618 of B-C (1285) which can take it to 4895 but that will negate the gartley pattern in totality, hence I presume Nifty to stop some where 5530-5560 range for this pattern.
Today Nifty closed at 5696.50. Posted for academic purposes only.
SHEKHAR
| Description: |
|
| Filesize: |
85.54 KB |
| Viewed: |
703 Time(s) |

|
Last edited by shekharinvest on Sat Jan 22, 2011 1:57 pm; edited 1 time in total |
|
| Back to top |
|
 |
|
|
 |
sandew
White Belt

Joined: 02 Feb 2009
Posts: 174
|
Post: #2  Posted: Fri Jan 21, 2011 9:44 pm Post subject: Hi Posted: Fri Jan 21, 2011 9:44 pm Post subject: Hi |
 |
|
Hi Shekhar,
Trade the gartley only when it is completed.
and
Do not pre-judge what type of gartley it is going to be, till it is completed.
I know you know this, but I was just looking for a reason to say Hi to you.
|
|
| Back to top |
|
 |
amitkbaid1008
Yellow Belt

Joined: 04 Mar 2009
Posts: 540
|
Post: #3  Posted: Fri Jan 21, 2011 10:00 pm Post subject: Posted: Fri Jan 21, 2011 10:00 pm Post subject: |
 |
|
Hi Shekhar
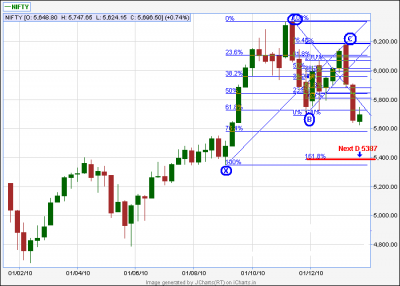
Most likely it is to go to levels 5387 as marked by me on weekly NIFTY chart along with all points of GARTLEY PATTERN along with Fibonacci.
As per explanation of GARTLEY PATTERN "At C, the price again reverses with retracement CD between 127% and 161.8% of the range BC and is shown along the line BD. Price D is the point to buy/sell (bullish/bearish Gartley pattern) as the price is about to increase/decrease. "
161.8% as indicated by you comes to C-B => 6181-5690=491
C-B*1.618=794
D is 6181-794=5387
| Description: |
|
| Filesize: |
22.63 KB |
| Viewed: |
652 Time(s) |

|
|
|
| Back to top |
|
 |
rohit44
White Belt

Joined: 05 Jan 2010
Posts: 279
|
Post: #4  Posted: Sat Jan 22, 2011 2:58 am Post subject: Posted: Sat Jan 22, 2011 2:58 am Post subject: |
 |
|
| ....great job done....can we assume atleast 5555 level in jan?? or any pull back till 5800 5900 is on cards??....please share the same pattern if found in stocks too....found this as most reliable pattern...isn't it???
|
|
| Back to top |
|
 |
aag
White Belt

Joined: 24 Dec 2008
Posts: 9
|
Post: #5  Posted: Sat Jan 22, 2011 4:56 am Post subject: Posted: Sat Jan 22, 2011 4:56 am Post subject: |
 |
|
@ shekhar.
take a look at rcom. i think u might like what you see.
|
|
| Back to top |
|
 |
acharyams
Yellow Belt

Joined: 04 Jul 2010
Posts: 552
|
Post: #6  Posted: Sat Jan 22, 2011 8:41 am Post subject: Re: Gartley Pattern Posted: Sat Jan 22, 2011 8:41 am Post subject: Re: Gartley Pattern |
 |
|
Shekharji,
What if nifty reverses its course from here leaving 5620 as bottom?
Will the pattern remain valid in that case with 6500+ target intact?
|
|
| Back to top |
|
 |
shekharinvest
Yellow Belt

Joined: 21 Dec 2007
Posts: 549
|
|
| Back to top |
|
 |
ashis
White Belt

Joined: 28 Mar 2010
Posts: 75
|
Post: #8  Posted: Thu Jan 27, 2011 11:38 am Post subject: Re: Trading Gartleys Posted: Thu Jan 27, 2011 11:38 am Post subject: Re: Trading Gartleys |
 |
|
Dear Shekhar
As per Gartley Patten when D fforms then this pattern is complete then how can we presume 6522?
Is it after achieving D market will go up as difrrence between XA?
Please guide.
Regards
Ashis
| shekharinvest wrote: | Hi,
Posted below is a chart of Nifty as it unfolds. It seems that it is making a Gartley pattern. So far symmetry is good. Should it take support at 5530-5560 area and then reverses it can do 6525-6550.
Gartley is a complex price pattern based on Fibonacci numbers/ratios. It is used to determine buy and sell signals by measuring price retracements of a stock's up and down movement in stock price.
X - 5349
A - 6339
B - 5690
C - 6181
D - ??? ( 5532, 5557, 5560)
X-A = 990
A-B = 649
B-C = 491
C-D = ??? ( 649, 624 )
A-B = .618 OF XA
B-C = .786 OF A-B (almost)
C-D min has to be 1.272% of B-C (624) and max it can be 2.618 of B-C (1285) which can take it to 4895 but that will negate the gartley pattern in totality, hence I presume Nifty to stop some where 5530-5560 range for this pattern.
Today Nifty closed at 5696.50. Posted for academic purposes only.
SHEKHAR |
|
|
| Back to top |
|
 |
shekharinvest
Yellow Belt

Joined: 21 Dec 2007
Posts: 549
|
Post: #9  Posted: Fri Jan 28, 2011 2:13 pm Post subject: Posted: Fri Jan 28, 2011 2:13 pm Post subject: |
 |
|
Bought some Niftybees @ 5500 NS SL below X will add some more if get lower levels in coming days.
SHEKHAR
Last edited by shekharinvest on Mon Jan 31, 2011 2:49 pm; edited 2 times in total |
|
| Back to top |
|
 |
amitkbaid1008
Yellow Belt

Joined: 04 Mar 2009
Posts: 540
|
Post: #10  Posted: Fri Jan 28, 2011 8:45 pm Post subject: Posted: Fri Jan 28, 2011 8:45 pm Post subject: |
 |
|
| shekharinvest wrote: | Bought some Niftybees @ 5500 NS SL below X will add some more if get lower levels in coming days.
SHEKHAR |
Shekhar
Why just NIFTYBEES why not NIFTY Futures or Call Option?
It just around 150 points of SL & gains can be huge!!!
|
|
| Back to top |
|
 |
rohit44
White Belt

Joined: 05 Jan 2010
Posts: 279
|
Post: #11  Posted: Fri Jan 28, 2011 9:05 pm Post subject: Posted: Fri Jan 28, 2011 9:05 pm Post subject: |
 |
|
| Dear shekhar and amit......gartley pattern which is under construction is a bullish patter na?? kindly confirm.....can we start shopping? or lower tgt like 5200/5100 or may be 4700 as some analyst said can be expected??? kindly advise
|
|
| Back to top |
|
 |
amitkbaid1008
Yellow Belt

Joined: 04 Mar 2009
Posts: 540
|
Post: #12  Posted: Fri Jan 28, 2011 11:23 pm Post subject: Posted: Fri Jan 28, 2011 11:23 pm Post subject: |
 |
|
| rohit44 wrote: | | Dear shekhar and amit......gartley pattern which is under construction is a bullish patter na?? kindly confirm.....can we start shopping? or lower tgt like 5200/5100 or may be 4700 as some analyst said can be expected??? kindly advise |
Dear Rohit
If there is gartley that will be bullish gartley.
Then 6600 is on cards
|
|
| Back to top |
|
 |
rohit44
White Belt

Joined: 05 Jan 2010
Posts: 279
|
Post: #13  Posted: Sat Jan 29, 2011 1:21 am Post subject: Posted: Sat Jan 29, 2011 1:21 am Post subject: |
 |
|
| Thank you.....should we start shopping @ 5380 levels....if yes any sl or level to keep in mnd???
|
|
| Back to top |
|
 |
aag
White Belt

Joined: 24 Dec 2008
Posts: 9
|
Post: #14  Posted: Sat Jan 29, 2011 4:21 am Post subject: Posted: Sat Jan 29, 2011 4:21 am Post subject: |
 |
|
Without a doubt is a bullsh gartley. 5600 was the zone for D. hence my loud claim on 14th that its a selling climax.
now, however, it looks like 5400 might also come.
but, its a completed bullish gartley.
NF will see 6300. dont miss the ride.

|
|
| Back to top |
|
 |
shekharinvest
Yellow Belt

Joined: 21 Dec 2007
Posts: 549
|
Post: #15  Posted: Sat Jan 29, 2011 9:26 am Post subject: Posted: Sat Jan 29, 2011 9:26 am Post subject: |
 |
|
| amitkbaid1008 wrote: |
Shekhar
Why just NIFTYBEES why not NIFTY Futures or Call Option?
It just around 150 points of SL & gains can be huge!!! |
Amit,
i) One cannot go with "calls only' because we do not know how long will it take to achieve the targets and then there is a price attached to buying the calls and rolling them over and over. Presently March 2011 5500 CE is @ 242 and April 2011 5500 CE@ 290 if we buy a long term call.
ii) Similarly with NF one has to deal with M to M on daily basis.
iii) Niftybees has a very good attribute that it affords us good nights sleep. 
iv) Most important of all I am trading Gartley for the first time.
If you need larger exposer simply buy more in numbers.
SHEKHAR
|
|
| Back to top |
|
 |
|

