| View previous topic :: View next topic |
| Author |
trading patterns |
sunrays
White Belt

Joined: 19 Dec 2009
Posts: 71
|
|
| Back to top |
|
 |
|
|  |
shekharinvest
Yellow Belt

Joined: 21 Dec 2007
Posts: 549
|
Post: #2  Posted: Thu Jul 29, 2010 8:13 pm Post subject: Re: trading patterns Posted: Thu Jul 29, 2010 8:13 pm Post subject: Re: trading patterns |
 |
|
| sunrays wrote: | hello ichartians.....let us use this thread to display the different charting patterns that we commonly find in stocks that can be used to project targets,supports and resistance....senior/experts/juniors do make corrections or compliments  as and when desired as and when desired |
Sunrays,
Thanks for starting a new thread but do keep it running hope ppl will participate and enrich the community.
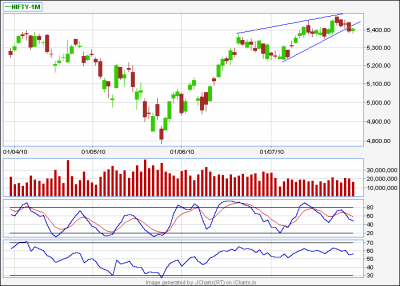
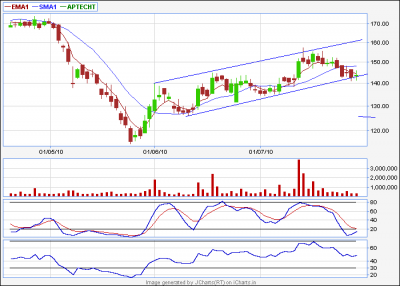
APTECHT is not a rising wedge. rising wedge looks like somewhat as shown in the NIFTy-1m chart.
APTECHT is just at the lower TL of channelled move. It is a buy with small SL. Low risk entry here. One can also wait until STS crossover, SL will increase.
SHEKHAR
| Description: |
|
| Filesize: |
21.7 KB |
| Viewed: |
405 Time(s) |
|
| Description: |
|
| Filesize: |
11.74 KB |
| Viewed: |
384 Time(s) |
|
|
|
| Back to top |
|
 |
sunrays
White Belt

Joined: 19 Dec 2009
Posts: 71
|
Post: #3  Posted: Thu Jul 29, 2010 8:29 pm Post subject: Posted: Thu Jul 29, 2010 8:29 pm Post subject: |
 |
|
shekar sir ...thnx for correcting me....definetly will keep this thread alive
as far as a rising wedge is considered it luks more like a contraction in prices wid a triangle like formation towards the end
|
|
| Back to top |
|
 |
sunrays
White Belt

Joined: 19 Dec 2009
Posts: 71
|
Post: #4  Posted: Sun Aug 01, 2010 5:43 pm Post subject: bands and channels Posted: Sun Aug 01, 2010 5:43 pm Post subject: bands and channels |
 |
|
BANDS AND CHANNELS
By Daryl Guppy
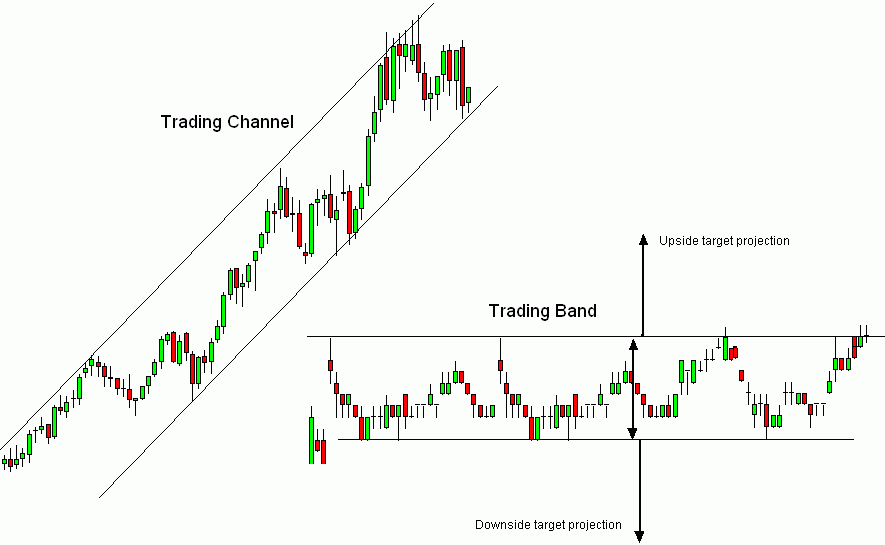
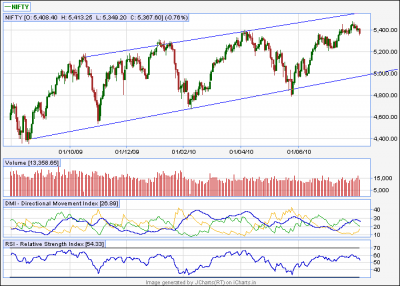
Trading bands and trading channel are related. Both chart patterns act as a restraint on price activity, confining it within defined boundaries. The channel defines trend behaviour. The band defines support and resistance behaviour and can be used to set price targets.
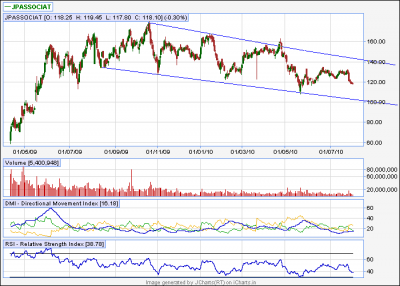
The trading channel is constructed with two trend sloping trend lines. These are parallel lines and as with any trend line, their value changes daily. The lines show changing sentiment about value. A trading channel shows the limits of this changing sentiment as price bounces from support and retreats from resistance.
The trading band is defined by support and resistance levels where the value remains constant. These are horizontal parallel lines. Price stops trending and develops a sideways movement. These patterns are more useful because they are used to project upside and downside targets. When price moves above the resistance level then the width of the trading and is used to set the potential upside target.
Both trading bands and trading channels are range-bound chart features. They provide short term trading opportunities as price moves between the support and resistance levels. However the range bound trend continuation of a trading channel is traded differently from the trading band with its potential for trade band breakout opportunities.
| Description: |
|
| Filesize: |
11.2 KB |
| Viewed: |
1496 Time(s) |
|
| Description: |
| jp associates trading channel |
|
| Filesize: |
16.36 KB |
| Viewed: |
371 Time(s) |
|
|
|
| Back to top |
|
 |
sunrays
White Belt

Joined: 19 Dec 2009
Posts: 71
|
Post: #5  Posted: Sun Aug 01, 2010 6:58 pm Post subject: Posted: Sun Aug 01, 2010 6:58 pm Post subject: |
 |
|
nifty trading channel on daily chart
| Description: |
|
| Filesize: |
16.59 KB |
| Viewed: |
373 Time(s) |
|
|
|
| Back to top |
|
 |
sunrays
White Belt

Joined: 19 Dec 2009
Posts: 71
|
Post: #6  Posted: Sat Aug 07, 2010 9:59 am Post subject: Posted: Sat Aug 07, 2010 9:59 am Post subject: |
 |
|
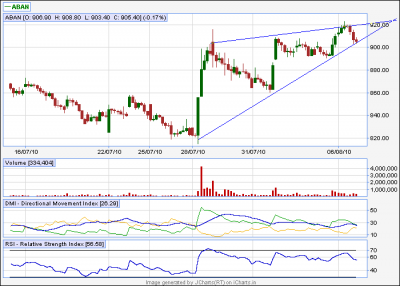
Rising wedge pattern in aban 60mts chart
| Description: |
|
| Filesize: |
12.64 KB |
| Viewed: |
394 Time(s) |
|
|
|
| Back to top |
|
 |
|
|
You cannot post new topics in this forum
You cannot reply to topics in this forum
You cannot edit your posts in this forum
You cannot delete your posts in this forum
You cannot vote in polls in this forum
You can attach files in this forum
You can download files in this forum
|
Powered by phpBB © 2001, 2005 phpBB Group
|
|

