| View previous topic :: View next topic |
| Author |
Trading pullbacks in uptrends |
SwingTrader
Site Admin
Joined: 11 Aug 2006
Posts: 2903
Location: Hyderabad, India
|
|
| Back to top |
|
 |
|
|
 |
LEOLIVINGSTON
White Belt

Joined: 01 Nov 2006
Posts: 1
|
Post: #2  Posted: Wed Nov 22, 2006 3:24 pm Post subject: Posted: Wed Nov 22, 2006 3:24 pm Post subject: |
 |
|
 GOOD STRAGEY PLS CAN U TELL ME HOW TO CALCULATE NIFTY INTRA DAY RANGE OR POST IT IN YOUR SITE GOOD STRAGEY PLS CAN U TELL ME HOW TO CALCULATE NIFTY INTRA DAY RANGE OR POST IT IN YOUR SITE
|
|
| Back to top |
|
 |
shariqt
White Belt

Joined: 15 Nov 2006
Posts: 11
|
Post: #3  Posted: Thu Nov 23, 2006 12:59 am Post subject: Posted: Thu Nov 23, 2006 12:59 am Post subject: |
 |
|
Hi Swing trader, first of all thanks a lot for putting up such a wonderful site. I am a newcomer to this site and I am hooked to it. To be honest i have made gud use of ur intra day charts.
The strategy is Buying on the MACD crossover in 15/30/60 minutes chart and selling vice versa.
Another strategy will be to Buy when the shorter SMA cross over longer SMA and to Sell when shorter SMA Cross down the longer SMA. Usually i follow 20/50 SMA.
In both the above strategies, the shorter time frame i.e. 15 minutes gives an indication and trade after watching 30-60 minutes charts, because the 15 minutes chart can give whipsaw signals trigering ur stop losses.
I hope you observe this strategy.
Happy trading.
|
|
| Back to top |
|
 |
SwingTrader
Site Admin
Joined: 11 Aug 2006
Posts: 2903
Location: Hyderabad, India
|
Post: #4  Posted: Thu Nov 23, 2006 9:38 am Post subject: Posted: Thu Nov 23, 2006 9:38 am Post subject: |
 |
|
Thanks, I am glad you like the website.
Your both strategies look good. Watching multiple time-frames for entries is widely considered to be a very good idea. Thanks for sharing your strategies, I will certainly take a look at these.
_________________
Srikanth Kurdukar
@SwingTrader |
|
| Back to top |
|
 |
doji
White Belt

Joined: 22 Nov 2006
Posts: 31
|
Post: #5  Posted: Fri Nov 24, 2006 7:35 am Post subject: Posted: Fri Nov 24, 2006 7:35 am Post subject: |
 |
|
I have recently become a memeber here.
Without doubt, this is the BEST free Indian site for charts.
|
|
| Back to top |
|
 |
kkseal
White Belt

Joined: 29 Nov 2006
Posts: 8
|
Post: #6  Posted: Thu Nov 30, 2006 3:38 am Post subject: Posted: Thu Nov 30, 2006 3:38 am Post subject: |
 |
|
Hi SwingTrader,
I use a somewhat simillar strategy for my Swingtrades I don't know much about CCI though I use slow Stochastics & price&EMA movement for my entries.
The best indicator to use however would be the FORCE INDEX (not the raw but the EMA version) as it takes both price & volume into account. A 2/3 day EMA used in conjunction with a longer period (12/20 day) would be ideal with the shorter period FI signalling pullbacks while the longer period FI the primary trend. (TRIX on the daily & MACD on the weekly charts is also a helpful way to ascertain if the primary trend is intact)
Please do consider including the FORCE INDEX in your next update The construction is simple : (Todays price - yesterdays price) * Todays volume An n-period EMA of the FI is then plotted. For making use of crossovers the indicator plot should be able to take 2 parameters say FORCE INDEX 12, 3 This should plot a 12 & 3 period EMA of the (raw) FI on the same chart.
Thanks
Kalyan
|
|
| Back to top |
|
 |
SwingTrader
Site Admin
Joined: 11 Aug 2006
Posts: 2903
Location: Hyderabad, India
|
Post: #7  Posted: Thu Nov 30, 2006 9:32 am Post subject: Posted: Thu Nov 30, 2006 9:32 am Post subject: |
 |
|
Interesting. I will plan on adding the FORCE INDEX. I will also check it out in detail and see if it adds further value to the above strategy.
Thanks for posting the information.
_________________
Srikanth Kurdukar
@SwingTrader |
|
| Back to top |
|
 |
SwingTrader
Site Admin
Joined: 11 Aug 2006
Posts: 2903
Location: Hyderabad, India
|
Post: #8  Posted: Thu Nov 30, 2006 9:34 am Post subject: Posted: Thu Nov 30, 2006 9:34 am Post subject: |
 |
|
| LEOLIVINGSTON wrote: |  GOOD STRAGEY PLS CAN U TELL ME HOW TO CALCULATE NIFTY INTRA DAY RANGE OR POST IT IN YOUR SITE GOOD STRAGEY PLS CAN U TELL ME HOW TO CALCULATE NIFTY INTRA DAY RANGE OR POST IT IN YOUR SITE |
Leo,
Sorry, forgot to reply to your post. Can you please explain more about what you want? I did not completely understand. Or better just ask in the "Live Shoutbox", I am sure someone there would know more about this...
_________________
Srikanth Kurdukar
@SwingTrader |
|
| Back to top |
|
 |
kkseal
White Belt

Joined: 29 Nov 2006
Posts: 8
|
Post: #9  Posted: Thu Nov 30, 2006 9:28 pm Post subject: Posted: Thu Nov 30, 2006 9:28 pm Post subject: |
 |
|
Hi Swingtrader,
Here's the link where you can find fairly comprehensive info on FORCE INDEX & the 7 trading rules based on FI : http://option-wizard.com/features/force.shtm
A programmer’s trick to make the Force Index exponential moving average (EMA) numbers smaller and more chartable: divide Force Index by the price of the underlying security.
So the formula would change to (Close Today - Close Yesterday) * Volume Today / Close Today
Cheers
Kalyan
|
|
| Back to top |
|
 |
altafghanchi
White Belt

Joined: 06 Jan 2008
Posts: 7
|
Post: #10  Posted: Sun Oct 25, 2009 12:16 am Post subject: trading pulback in up trend Posted: Sun Oct 25, 2009 12:16 am Post subject: trading pulback in up trend |
 |
|
respectedsir,
ihave fowling setting for short term trsding please correct me
60mintsTF
3,15 EMAS
RSI-3......{SIR,my comfusion is entry on 50or 70 as u have sujested in cci-3 -90 and+90)
...i strickly obey trend i never go against trend
....at present my sucess raio is only 55 percent
...sir please help me
|
|
| Back to top |
|
 |
shekharinvest
Yellow Belt

Joined: 21 Dec 2007
Posts: 549
|
Post: #11  Posted: Mon Oct 26, 2009 6:20 pm Post subject: Posted: Mon Oct 26, 2009 6:20 pm Post subject: |
 |
|
ST,
Market has given answer to my query in SB.
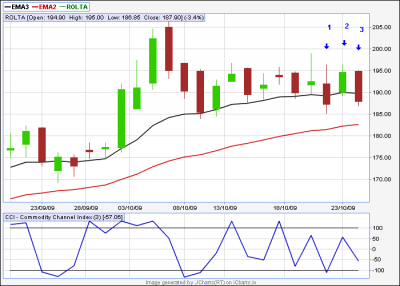
Please refer to your post para 4 wherein you have stated that "I wait for the next 3-4 bars to see if the previous bar's high is broken" could you please clarify which previous bar are you refering to ?
(i) the one for which the value of cci went below -90 for the first time.
(ii) or the one which is immediate previous to the current bar.
I am enclosing the chart for Rolta (daily) which is in uptrend and cci has dipped below -90 after the close of candle 1. We can take entry had the candle 2 moved past the high of candle 1, that is simple to understand, which did not happen, neither did candle 3 moved past candle 1 and 2's high. for the next day i.e. coming day price must takeout the high of previous candle to give a valid entry . which one is the previous candle the original one, candle-1 or the recent candle, candle-3
ST, where do you place the initial SL.
I hope I have made myself clear.
Highly appreciate if you could take some time-out to explain.
SHEKHAR
| Description: |
|
| Filesize: |
22.91 KB |
| Viewed: |
605 Time(s) |

|
|
|
| Back to top |
|
 |
sriki_r
White Belt

Joined: 05 Apr 2009
Posts: 15
|
Post: #12  Posted: Wed Oct 28, 2009 5:26 pm Post subject: Posted: Wed Oct 28, 2009 5:26 pm Post subject: |
 |
|
ST,
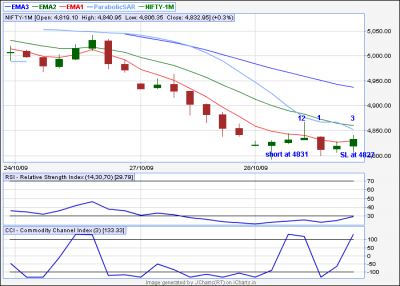
I am attaching the NF chart of 60 min tf. I have few questions on this strategy:
1] At 12PM, the CCI was above +90 and the 10 ad 30 EMA has shown its a downtrend.
2] The 12PM candle low was 4831.95 and at 1PM candle, this low was broken.
3] So i entered short trade at 4831. I did not wait for the 1PM candle to close when i entered the trade. Should i need to wait for the candle to close to enter trade?
4] My SL at this stage was high of 12PM candle that is 4867.
5] In 2PM candle, the high was 4828 and i moved my SL to 4828 after the 2PM candle close. Is it correct?
5] At 3PM candle the SL got hit and i gained only 3 points.
6] If i had closed my trade at the low of 1PM candle, i would have closed the trade at 4800 gaining 28 points.
7] I am not sure what i have done is correct according to this strategy. Should i need to wait for the candle to close?
8] What do you suggest to take profits earlier on or having proper SL?
Thanks,
Sriki
| Description: |
|
| Filesize: |
27.69 KB |
| Viewed: |
657 Time(s) |

|
|
|
| Back to top |
|
 |
shekharinvest
Yellow Belt

Joined: 21 Dec 2007
Posts: 549
|
Post: #13  Posted: Thu Oct 29, 2009 9:55 am Post subject: Posted: Thu Oct 29, 2009 9:55 am Post subject: |
 |
|
Sriki,
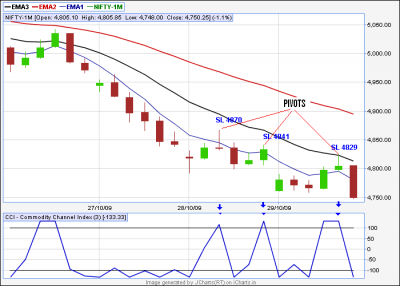
I think your entry was perfect. The SL was appropriate i.e high of the candle you could have added 2 or 3 points to it as filter. The only error in your trade was that you brought down you sl to 4828 it should have been still at 4870 and trade carried over to the next day. SL,s should be moved only on the formation of the new pivot.
SHEKHAR
|
|
| Back to top |
|
 |
sriki_r
White Belt

Joined: 05 Apr 2009
Posts: 15
|
Post: #14  Posted: Thu Oct 29, 2009 4:43 pm Post subject: Posted: Thu Oct 29, 2009 4:43 pm Post subject: |
 |
|
SHEKHAR,
You have mentioned | Code: | | SL's should be moved only on the formation of the new pivot. |
Could you explain with an example?
You can take todays' [29th Oct 09] 60 min tf chart as an example and tell me when i should have moved my SL and why?
Thanks,
Sriki
|
|
| Back to top |
|
 |
shekharinvest
Yellow Belt

Joined: 21 Dec 2007
Posts: 549
|
Post: #15  Posted: Thu Oct 29, 2009 5:13 pm Post subject: Posted: Thu Oct 29, 2009 5:13 pm Post subject: |
 |
|
Hi,
One can carry shorts with the SL marked on the chart. The trade has been as initiated by Sriki.
Fresh short could have been initiated today below 4795 with SL 4829.
Sriki, I have marked the pivots on the chart and SL has been moved lower & lower as the trade progresses with 3 pts. filter.
You need to learn more. Kindly visit traderji.com ( ST/PT : I believe I am not violating any rule) there you will find a thread: Teach a man fishing .. by SAINT please go thru it and you will learn a lot - much more than any trading book.
SHEKHAR
| Description: |
|
| Filesize: |
36.12 KB |
| Viewed: |
621 Time(s) |

|
|
|
| Back to top |
|
 |
|

