| View previous topic :: View next topic |
| Author |
Trading Strategy for Copper |
infinity
White Belt

Joined: 09 Aug 2010
Posts: 49
|
Post: #1  Posted: Sat Feb 18, 2012 6:38 pm Post subject: Trading Strategy for Copper Posted: Sat Feb 18, 2012 6:38 pm Post subject: Trading Strategy for Copper |
 |
|
Hello Friends
I honestly do not know whether to call this as a trading system or otherwise. May be lot of friends are already following this system; however I have tried to put few points together making it a system. I had back tested this system and using continuously since quiet some time successfully on Copper. This may be used for other commodities with some minor modification. Details are as follows –
Commodity – Copper
Time Frame – 2 minutes
RSI – (5,20,80)
Please note here RSI 5 is selected with 20 and 80 unlike standard setting of 30 & 70. This is mainly to reduce number of signals getting generated. Any other indicator is absolutely not required in this trading system. I am aware that at least 2 indicators are required to make any trading system work efficiently; however due to very low time frame and very low RSI there are very less divergences and due to widening of OB & OS limit to 20 & 80 very less whipsaws.
For going Long –
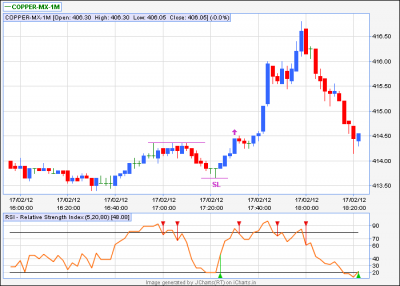
When day starts and starts giving RSI readings please ignore completely yesterdays reading / status of RSI. Consider today’s signals only. As time progresses RSI will move either towards OB or OS zone. For this system to work you will have to have patience till at least once RSI visits OB and immediately after that visits OS zone. Now you have to place stop buy order above highest point when RSI was OB. SL would be lowest point when RSI was OS. Please ensure now RSI doesn’t visit OS area. If so it simply means downward movement is yet to be over.
For going Short –
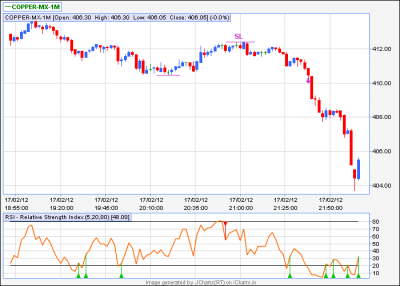
Once RSI visits OS and immediately after that visits OB zone. Now you have to place stop sell order below lowest point when RSI was OS. SL would be highest point when RSI was OB. Please ensure now RSI doesn’t visit OB area. If so it simply means upward movement is yet to be over.
Calculation of initial Target
Target is difference between High and Low marked for stop buy or stop sell order and Stop loss
i.e. Target for Long = Latest High + (Latest High – Latest Low)
& Target for Short = Latest Low – (Latest High - Latest Low)
In other words this strategy expects to give minimum 1:1 RR ratio
Now after this there are 2 possibilities –
A. price may continue to move in the direction of the trade
B. price may retrace back to entry point
You may continue to hold 50% position even after target is achieved by booking profit for 50% of the position and placing TSL for balance 50% –
• below recent OS lowest point; which was generated while achieving target; in case of going long.
• above recent OB highest point; which was generated while achieving target; in case of going short.
Please note that –
a. when you are long and price revisits OS area there is every chance that you will feel like going short because of breaking of earlier low level. However treat up to Rs. 0.45 below earlier lowest level as buy signal and below this place stop sell order for going short.
b. Similarly when price revisits OB area there is every chance that you will feel like going long because of breaking of earlier high level. However treat up to Rs. 0.45 above earlier higher level as buy signal and above this place stop buy order for going long.
c. When RSI5 revisits OS zone however price is not nearby earlier lower price; and found to be on higher side; this is a time to add position which you got rid off some time back.
d. Same is applicable for going short. When RSI5 revisits OB zone however price is not nearby earlier higher price; and found to be on lower side; this is a time to add position which you got rid off some time back.
This system can be applied for various objectives as detailed below –
1. Scalping
2. Intraday trading
3. Trading in counter direction of main trend
4. Beneficial for part time traders due to more no. of signals are getting generated
5. May continue to be in trade always
Two sample trades of 17.02.12 are attached for understanding and ready reference.
| Description: |
|
| Filesize: |
18.56 KB |
| Viewed: |
747 Time(s) |

|
| Description: |
|
| Filesize: |
21.52 KB |
| Viewed: |
707 Time(s) |

|
|
|
| Back to top |
|
 |
|
|  |
rk_a2003
Black Belt

Joined: 21 Jan 2010
Posts: 2734
|
Post: #2  Posted: Sun Feb 19, 2012 10:15 am Post subject: Posted: Sun Feb 19, 2012 10:15 am Post subject: |
 |
|
Infinity
I have yet to trade commodities .How ever after going through your posting I feel that it was a well-thought-out trading system at least logically. First it’s waiting for a range to form and then trading the range break out.
Sometimes rewards could be fabulous if someone follow a good trailing stop loss (it could be true for every strategy).
You could have marked first target also on both the charts. It can be named as opening range break out trading system in commodities.
I think that this system also should work well in trending market .As usual it may whipsaw you in range bound markets.
One may comfortably apply it in trending markets.
What about equity? will it work in equity’s as well?? If not why???
Thanks for presenting one more system/Strategy for our use.
I know how pain staking it is to formulate one and to back test it/test it and present it.
Congatulations! for doing it well.
|
|
| Back to top |
|
 |
vinay28
Black Belt

Joined: 24 Dec 2010
Posts: 11748
|
Post: #3  Posted: Sun Feb 19, 2012 10:45 am Post subject: Posted: Sun Feb 19, 2012 10:45 am Post subject: |
 |
|
someone sent me a private message on this thread I can't find it.
Infinity, you should also ask casper about this
|
|
| Back to top |
|
 |
infinity
White Belt

Joined: 09 Aug 2010
Posts: 49
|
Post: #4  Posted: Sun Feb 19, 2012 11:44 pm Post subject: Posted: Sun Feb 19, 2012 11:44 pm Post subject: |
 |
|
| rk_a2003 wrote: | Infinity
I have yet to trade commodities .How ever after going through your posting I feel that it was a well-thought-out trading system at least logically. First it’s waiting for a range to form and then trading the range break out.
Sometimes rewards could be fabulous if someone follow a good trailing stop loss (it could be true for every strategy).
You could have marked first target also on both the charts. It can be named as opening range break out trading system in commodities.
I think that this system also should work well in trending market .As usual it may whipsaw you in range bound markets.
One may comfortably apply it in trending markets.
What about equity? will it work in equity’s as well?? If not why???
Thanks for presenting one more system/Strategy for our use.
I know how pain staking it is to formulate one and to back test it/test it and present it.
Congatulations! for doing it well.
|
Thank you RK sir for your appreciation.
We are trying to encash movement of stock / commodity which is gaining momentum by effectively making use of smaller time frame.
This strategy works very well in trending as well as in range bound markets. Only issue is to set parameters by duly back testing. As for example in case of Copper if you have a low at a particular price mostly that low holds good while price retraces back but when it slips it does not slip beyond Rs. 0.45 and bounces back; hence rule of Rs. 0.45 has become part of the system. When it slips beyond Rs. 0.45 it is a sell signal. On an average this should be around 0.10%.
Similarly in case of equity & nifty you need to find out such values which belong to that particular scrip; then set RSI which may be 3 or 4 or 5 and OB & OS zones are to be set to 20-80 or 30-70 zones; depending on vibration of each equity or nifty.
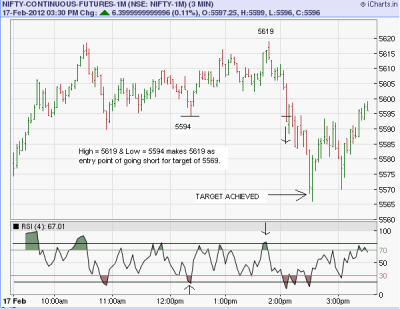
I have tried to capture trade for Nifty movement of 17.02.12. Please note I have not back tested it yet.
In case of range bound activity if RSI enters OB zone along with actual price at earlier higher level then go short with very small stop loss above high of earlier higher price. Then in case price reaches OS zone alongwith price to earlier low go long with very small stoploss. I agree with you that any strategy can lead to whipsaw in some percentage.
We can take example of the attached graph of Nifty for explanation of range bound movement. At 10.54 Hrs. Nifty low was 5590 and RSI was OS. At 12.21 Hrs. RSI reached OS zone however price was away and made low of 5594. One can go long here with stop loss below 5590 after appropriate study. As shown in attachment; there was a sell signal at 14.06 Hrs. candle.
For Nifty; RSI 4 with OS & OB zones as 20-80 are considered which please may be noted.
Hope I am able to explain properly.
Will try to post equity charts.
Infinity
| Description: |
|
| Filesize: |
21.78 KB |
| Viewed: |
669 Time(s) |

|
Last edited by infinity on Mon Feb 20, 2012 5:21 pm; edited 1 time in total |
|
| Back to top |
|
 |
sethu45
White Belt

Joined: 06 Aug 2009
Posts: 168
|
Post: #5  Posted: Mon Feb 20, 2012 5:29 am Post subject: Posted: Mon Feb 20, 2012 5:29 am Post subject: |
 |
|
The very speciality in the commodity is we can trade in all prices either short or long. All targets will be met. As said by infinity running with trailing stop could earn huge money. Have to have mind set that we should come out with profit only after entering in a trade irrespective of the direction the market will come and give you, but should have utmost patience and quite a bit money to meet the margin and MTM pressures. A good thread started keep posting good views on this. There are mini contracts which will be boom for small traders. Anyway congratulations for your initiative and my wishes to continue the same.
regds
sethuraman
|
|
| Back to top |
|
 |
|
|
You cannot post new topics in this forum
You cannot reply to topics in this forum
You cannot edit your posts in this forum
You cannot delete your posts in this forum
You cannot vote in polls in this forum
You can attach files in this forum
You can download files in this forum
|
Powered by phpBB © 2001, 2005 phpBB Group
|
|

