| View previous topic :: View next topic |
| Author |
TRADING THE BREAKOUTS: Positional Longs only |
shekharinvest
Yellow Belt

Joined: 21 Dec 2007
Posts: 549
|
Post: #1  Posted: Sun Jan 03, 2016 2:55 pm Post subject: TRADING THE BREAKOUTS: Positional Longs only Posted: Sun Jan 03, 2016 2:55 pm Post subject: TRADING THE BREAKOUTS: Positional Longs only |
 |
|
Starting this thread to trade breakouts in the stocks, all trades will be long only with medium term perspective. Post will be as and when opportunity presents itself and funds are available for investment 
The setup is taken from freely available material from the internet and the credit goes to respective Authors and initial few charts are their creation this fact is acknowledged. I shall post charts from Indian stocks to make my point.
Happy Trading !
SHEKHAR 
|
|
| Back to top |
|
 |
|
|
|
shekharinvest
Yellow Belt
Joined: 21 Dec 2007
Posts: 549
|
| Post: #2 Posted: Sun Jan 03, 2016 3:15 pm Post subject: |
|
|
SETUP
Before a stock makes our breakout “watch-list,†it must satisfy
two key criteria:
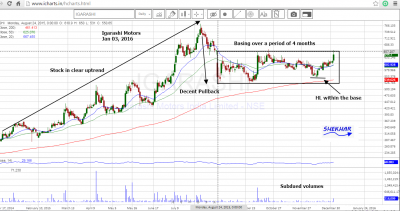
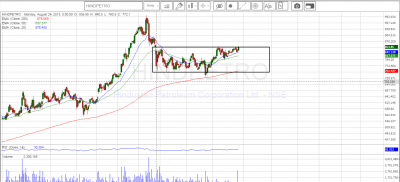
Stock must be in a clear and distinct uptrend
Stock must have a valid basing pattern
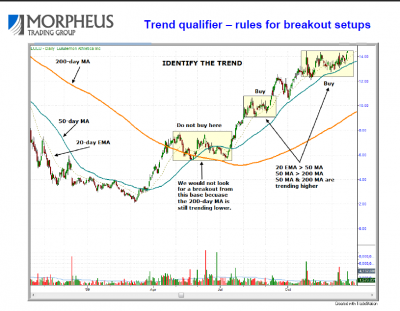
Stocks must be in a clear and distinct uptrend, as follows:
ô€º 20â€day EMA must be trading at or near the 50â€day MA when the stock
is forming a base and clearly above the 50â€day MA when in trend
mode. For pullback trades, the 20â€day EMA must be above the 50â€day
MA.
ô€º 20â€day EMA must be above the 200â€day MA
ô€º 50â€day MA must be above the 200â€day MA
ô€º Both the 50 and 200â€day MAs must be in a clear uptrend for at least a
few months.
ô€º The price action should be in an uptrend with a series of higher highs
and higher lows in place over the past 3 †6 months (at the very least).
ô€º Current price should at least be 30 †40% above the 52â€week low.
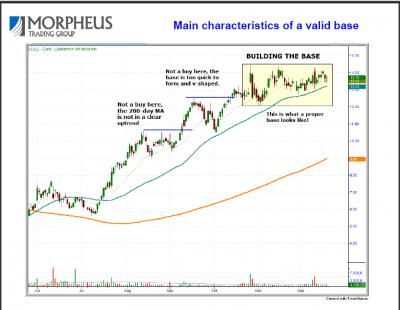
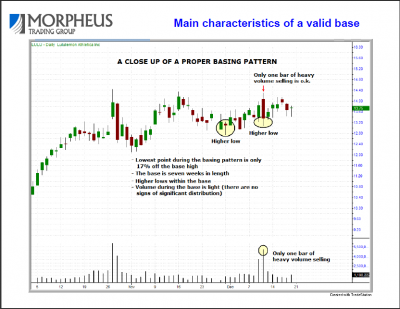
Stocks must have a valid basing pattern
ô€º A base (or zone of congestion) is anywhere from 1 month to 1
year in length. For our style of trading, we prefer bases that form
in a 1 - 3 month period that find and hold support of the 50-day
MA.
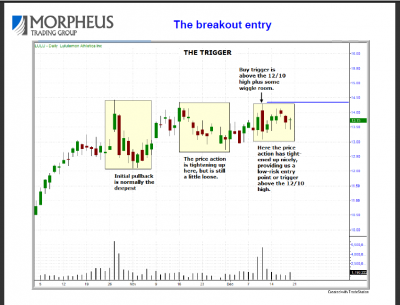
ô€º We want to see “tight†price action in the base, especially during
the last two weeks before the breakout.
ô€º A valid base should pullback anywhere from 10 - 30% off the
swing high. Once a stock retraces 40 - 50% or more, we begin to
question the strength of the uptrend.
ô€º We must see a “higher low†form within the base. This is crucial
to the pattern. Without a higher low forming, we have no way to
set a stop and therefore can not define the risk.
ô€º Volume should be declining during a base, or at the very least, not
heavier than average. If there are too many days of heavy
volume selling in a base, the base could be faulty.
NB: ST/ PT I have purposefully not deleted name of the trading group from the charts to acknowledge their work. I am not connected to them in any manner what so ever.
| Description: |
|
| Filesize: |
63.03 KB |
| Viewed: |
693 Time(s) |
|
| Description: |
|
| Filesize: |
46.04 KB |
| Viewed: |
661 Time(s) |
|
|
|
| Back to top |
|
|
shekharinvest
Yellow Belt
Joined: 21 Dec 2007
Posts: 549
|
| Post: #3 Posted: Sun Jan 03, 2016 3:22 pm Post subject: |
|
|
A close look into the Basing Pattern and Breakout Entry
| Description: |
|
| Filesize: |
50.56 KB |
| Viewed: |
659 Time(s) |
|
| Description: |
|
| Filesize: |
43.65 KB |
| Viewed: |
605 Time(s) |
|
|
|
| Back to top |
|
|
shekharinvest
Yellow Belt
Joined: 21 Dec 2007
Posts: 549
|
|
| Back to top |
|
|
shaheerzaman
White Belt

Joined: 05 Aug 2014
Posts: 93
|
| Post: #5 Posted: Sun Jan 03, 2016 8:22 pm Post subject: |
|
|
Shekhar,
Thanks for starting such a nice thread. All the best.
I read the setup. For the below chart of igrasahi motors, i think you should wait for the 50 day MA to turn up. Right now its flat.
Thanks
Shaheer
|
|
| Back to top |
|
|
S.S.
White Belt
Joined: 09 Feb 2011
Posts: 241
|
| Post: #6 Posted: Wed Jan 06, 2016 7:12 pm Post subject: |
|
|
long trigeer in igarashi shekhar ????
| shekharinvest wrote: | Here is the chart of Igarashi Motors I shall be keeping an eye on, in the coming days.
That's enough work for a day
Happy Trading
SHEKHAR |
|
|
| Back to top |
|
|
shekharinvest
Yellow Belt
Joined: 21 Dec 2007
Posts: 549
|
| Post: #7 Posted: Thu Jan 07, 2016 10:35 am Post subject: |
|
|
| S.S. wrote: | long trigeer in igarashi shekhar ????
| shekharinvest wrote: | Here is the chart of Igarashi Motors I shall be keeping an eye on, in the coming days.
That's enough work for a day
Happy Trading
SHEKHAR |
|
Yes Long triggered above 665 close SL is quite low at 551. I did entered above 665 but came out in the closing hours because it lost the significant gains it made in the day and SL was far away, shall look for fresh entry and possibly smaller SL.
Keep an Eye.
|
|
| Back to top |
|
|
shekharinvest
Yellow Belt
Joined: 21 Dec 2007
Posts: 549
|
|
| Back to top |
|
|
|