| View previous topic :: View next topic |
| Author |
Trading using ICharts levels... |
Ravi_S
Yellow Belt

Joined: 15 Jun 2009
Posts: 569
|
Post: #1  Posted: Mon Aug 08, 2011 6:59 pm Post subject: Trading using ICharts levels... Posted: Mon Aug 08, 2011 6:59 pm Post subject: Trading using ICharts levels... |
 |
|
Hi
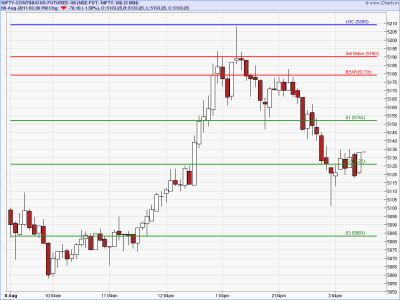
I was checking the iCHarts levels after long time... The market opened gap down between S2 and S3, broke S3 and did not touch S4, then it retraced back and came to LOC level exactly and then went down again... Can anyone who are trading these levels tell me how to trade using these levele? I remember there was a post sometime back in the forum by ST himself, but could not locate it. Thanks in advance..
Regards
Ravi
Icharts India
R5 -- 5473.02
R4 -- 5403.64
R3 -- 5334.26
R2 -- 5291.38
R1 -- 5264.88
...BULL -- 5238.38
LOC -- 5208.75
BEAR -- 5179.12
S1 -- 5152.62
S2 -- 5126.12
S3 -- 5083.24
S4 -- 5013.86
S5 -- 4944.48
|
|
| Back to top |
|
 |
|
|  |
SwingTrader
Site Admin
Joined: 11 Aug 2006
Posts: 2903
Location: Hyderabad, India
|
Post: #2  Posted: Mon Aug 08, 2011 8:48 pm Post subject: Re: Trading using ICharts levels... Posted: Mon Aug 08, 2011 8:48 pm Post subject: Re: Trading using ICharts levels... |
 |
|
| Ravi_S wrote: | Hi
I was checking the iCHarts levels after long time... The market opened gap down between S2 and S3, broke S3 and did not touch S4, then it retraced back and came to LOC level exactly and then went down again... Can anyone who are trading these levels tell me how to trade using these levele? I remember there was a post sometime back in the forum by ST himself, but could not locate it. Thanks in advance..
Regards
Ravi
|
Ravi,
Please check this post for basic stuff related to iCharts levels : http://www.icharts.in/forum/viewtopic,p,28288.html#28288
If you have any doubts, please let me know.
Today's market was different as price opened far away from the bands (bear-s1 / bull-r1). On such days look reversals after consolidations around a level. I do look for confluences also around the levels where this consolidation is taking place. Confluences can be fib related or indicator related. Usually when price opens far away from the key bands such reversals tend to take it to one of the key bands. Today NF consolidated around S3 and after a breakout went upto BEAR-S1 band (and stretched upto LOC) and reversed from there.
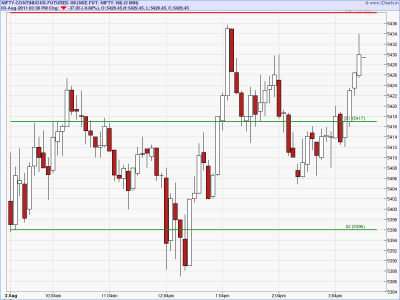
Similar example was 03.08.2011 when price opened near S2 and reversed twice from here to rise into BEAR-S1 band which was just above and reversed from the BEAR-S1 band twice.
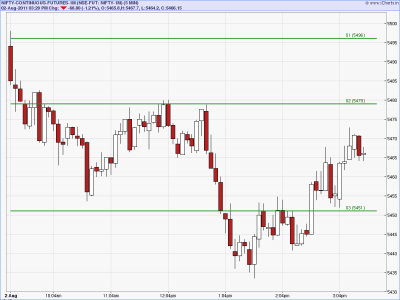
02.08.2011 was again different....price opened just below S1, hit resistance there immediately and kept going down. Tried to reverse from S2, could not, kept going down. It then reversed from just above S3, hit resistance at S2, again tried to breakout above S2 twice and failed and reversed down to below S3. Reversed just above S4, tried to breakout above S3 twice and then finally broke above S3. ALL THIS IS TO REINFORCE THE FACT THAT HOW PRICE REACTS TO THE LEVELS IS IMPORTANT. WATCH THE POSITION OF YOUR OTHER INDICATORS FOR CLUES TO REVERSALS WHEN PRICE GETS SUPPORTED/RESISTED AT THE LEVELS.
| Description: |
|
| Filesize: |
13.56 KB |
| Viewed: |
384 Time(s) |

|
| Description: |
|
| Filesize: |
12.98 KB |
| Viewed: |
357 Time(s) |

|
| Description: |
|
| Filesize: |
12.21 KB |
| Viewed: |
335 Time(s) |

|
_________________
Srikanth Kurdukar
@SwingTrader |
|
| Back to top |
|
 |
Ravi_S
Yellow Belt

Joined: 15 Jun 2009
Posts: 569
|
Post: #3  Posted: Mon Aug 08, 2011 9:28 pm Post subject: Re: Trading using ICharts levels... Posted: Mon Aug 08, 2011 9:28 pm Post subject: Re: Trading using ICharts levels... |
 |
|
Hi ST
Hope you are doing good... Thanks for your pointer on the link... I'll have a look at it.
Regards
Ravi
| SwingTrader wrote: | | Ravi_S wrote: | Hi
I was checking the iCHarts levels after long time... The market opened gap down between S2 and S3, broke S3 and did not touch S4, then it retraced back and came to LOC level exactly and then went down again... Can anyone who are trading these levels tell me how to trade using these levele? I remember there was a post sometime back in the forum by ST himself, but could not locate it. Thanks in advance..
Regards
Ravi
|
Ravi,
Please check this post for basic stuff related to iCharts levels : http://www.icharts.in/forum/viewtopic,p,28288.html#28288
If you have any doubts, please let me know.
Today's market was different as price opened far away from the bands (bear-s1 / bull-r1). On such days look reversals after consolidations around a level. I do look for confluences also around the levels where this consolidation is taking place. Confluences can be fib related or indicator related. Usually when price opens far away from the key bands such reversals tend to take it to one of the key bands. Today NF consolidated around S3 and after a breakout went upto BEAR-S1 band (and stretched upto LOC) and reversed from there.
Similar example was 03.08.2011 when price opened near S2 and reversed twice from here to rise into BEAR-S1 band which was just above and reversed from the BEAR-S1 band twice.
02.08.2011 was again different....price opened just below S1, hit resistance there immediately and kept going down. Tried to reverse from S2, could not, kept going down. It then reversed from just above S3, hit resistance at S2, again tried to breakout above S2 twice and failed and reversed down to below S3. Reversed just above S4, tried to breakout above S3 twice and then finally broke above S3. ALL THIS IS TO REINFORCE THE FACT THAT HOW PRICE REACTS TO THE LEVELS IS IMPORTANT. WATCH THE POSITION OF YOUR OTHER INDICATORS FOR CLUES TO REVERSALS WHEN PRICE GETS SUPPORTED/RESISTED AT THE LEVELS. |
|
|
| Back to top |
|
 |
|
|
You cannot post new topics in this forum
You cannot reply to topics in this forum
You cannot edit your posts in this forum
You cannot delete your posts in this forum
You cannot vote in polls in this forum
You can attach files in this forum
You can download files in this forum
|
Powered by phpBB © 2001, 2005 phpBB Group
|
|

