|
|
| View previous topic :: View next topic |
| Author |
trading with indicators |
rrk2006hyd
Yellow Belt

Joined: 13 Oct 2010
Posts: 874
|
Post: #1  Posted: Wed May 11, 2011 1:53 pm Post subject: trading with indicators Posted: Wed May 11, 2011 1:53 pm Post subject: trading with indicators |
 |
|
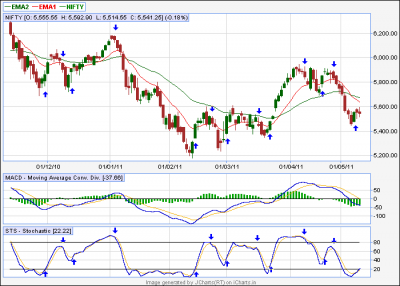
Trading with MACD(13,26,9)AND STS(13,3,3)
| Description: |
|
| Filesize: |
15.58 KB |
| Viewed: |
681 Time(s) |
|
Last edited by rrk2006hyd on Thu May 12, 2011 12:04 pm; edited 1 time in total |
|
| Back to top |
|
 |
|
| |
nareshusv
White Belt

Joined: 20 Sep 2009
Posts: 65
|
| Post: #2 Posted: Wed May 11, 2011 9:28 pm Post subject: |
|
|
dear rrk
what you wanted to explain.
 naresh naresh
|
|
| Back to top |
|
|
grizzlybull
White Belt
Joined: 26 Sep 2010
Posts: 80
|
| Post: #3 Posted: Wed May 11, 2011 10:57 pm Post subject: |
|
|
with all due respect, the moving average crossovers seem more effective and less "whipsawey"(if I may use that phrase) than the macd/stoch combo. (what parameters did you use for the moving averages,by the way?)
I experimented and backtested with the macd and stoch combo, it's a pretty good strategy. However you are looking for buy signals in a downtrending market, so many of the signals are not really practical, considering the macd is a double lagging indicator(a moving average of a moving average), and given the fact that advances in the downtrend(long term) last for a short time , not excusing any lag. they work very nicely as long as you know the main trend. (in the latest move we could have a long term reversal though, looking at the macd divergence  ) )
Personally, I feel the ma crossovers are better.
grizzlybull
|
|
| Back to top |
|
|
grizzlybull
White Belt
Joined: 26 Sep 2010
Posts: 80
|
| Post: #4 Posted: Wed May 11, 2011 11:31 pm Post subject: |
|
|
| sorry for the double post. additionally, an oscillator like the CCI will work as well.
|
|
| Back to top |
|
|
rrk2006hyd
Yellow Belt
Joined: 13 Oct 2010
Posts: 874
|
| Post: #5 Posted: Thu May 12, 2011 9:57 am Post subject: trading signals with DMI And STS |
|
|
Thanks friends for giving replys..
my intention is to find trading signals at any trend(downtrend or uptrend)..so..i'm experimenting with indicators...
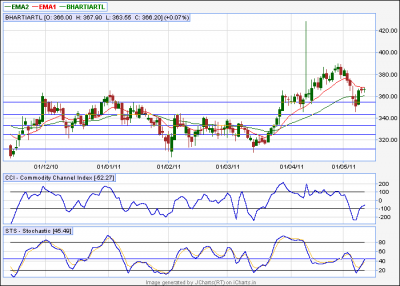
here i'm using EMA 13,EMA 39 AND CCI(13) AND STS(13,3,3)..AND ..and i'm using DMI(13,39) for trend strength.
according to Mr.grizzlybull, working with CCI is also giving good signals..
waiting for replys
| Description: |
|
| Filesize: |
14.97 KB |
| Viewed: |
577 Time(s) |
|
|
|
| Back to top |
|
|
opportunist
White Belt
Joined: 27 Apr 2010
Posts: 356
|
| Post: #6 Posted: Thu May 12, 2011 10:08 am Post subject: |
|
|
Hi all,
MACD is a lagging indicator. It all looks great when you see in hindsight. So backtesting works well on it. But per se the MACD is not of much use. Now why then we have it? It is to give a broad trend of markets being oversold or overbought. Its turning points though act as good signals.
Regards,
Opportunist
|
|
| Back to top |
|
|
grizzlybull
White Belt
Joined: 26 Sep 2010
Posts: 80
|
| Post: #7 Posted: Thu May 12, 2011 12:33 pm Post subject: |
|
|
| opportunist wrote: | Hi all,
MACD is a lagging indicator. It all looks great when you see in hindsight. So backtesting works well on it. But per se the MACD is not of much use. Now why then we have it? It is to give a broad trend of markets being oversold or overbought. Its turning points though act as good signals.
Regards,
Opportunist |
Yes, the turning points act as very good signals. That's because 0 line crossovers don't occur too often. However, what is a zero line crossing but an ma crossing?
Like I said before,the defect of lagging can be overlooked if the main trend is in your favour. No point in looking for bulls in a bear market, right?
|
|
| Back to top |
|
|
grizzlybull
White Belt
Joined: 26 Sep 2010
Posts: 80
|
| Post: #8 Posted: Thu May 12, 2011 1:03 pm Post subject: Re: trading signals with DMI And STS |
|
|
| rrk2006hyd wrote: | Thanks friends for giving replys..
my intention is to find trading signals at any trend(downtrend or uptrend)..so..i'm experimenting with indicators...
here i'm using EMA 13,EMA 39 AND CCI(13) AND STS(13,3,3)..AND ..and i'm using DMI(13,39) for trend strength.
according to Mr.grizzlybull, working with CCI is also giving good signals..
waiting for replys |
as seen in your diagram, overbought and oversold levels are quite similar.

Basically the concept is to determine:
1. the ob/os state, as measured my the oscillator.
2. the momentum shift, as determined by the macd.
This works BEAUTIFULLY in the bull market for buy and sell, and in the bear market for short selling. So it is better to know the long term trend as I said, or for the case of day traders, the medium term or short term trend.
The market your looking at, ie the airtel counter, is not a good place to use your buy indication as it is a secular bear, plus it seems to be moving in a range, where buying near support would prove to be better.
|
|
| Back to top |
|
|
rrk2006hyd
Yellow Belt
Joined: 13 Oct 2010
Posts: 874
|
| Post: #9 Posted: Thu May 12, 2011 1:27 pm Post subject: |
|
|
Helloo..Mr.grizzlybull,may i know what indicators u r using to find trends? and
thanks for giving replys
|
|
| Back to top |
|
|
waynegonsalves88
White Belt
Joined: 26 Aug 2010
Posts: 1
|
| Post: #10 Posted: Thu May 12, 2011 1:38 pm Post subject: |
|
|
hi all,
rrk2006hyd....how do get the buy and sell indicators on the candlestick charts??
|
|
| Back to top |
|
|
grizzlybull
White Belt
Joined: 26 Sep 2010
Posts: 80
|
| Post: #11 Posted: Thu May 12, 2011 1:53 pm Post subject: |
|
|
| rrk2006hyd wrote: | Helloo..Mr.grizzlybull,may i know what indicators u r using to find trends? and
thanks for giving replys |
I just first use the long term ma, anywhere between 100 to 200 days (or 20 week to 40 week) .. weighted ma is prefered, it isn't as fast as the ema and isnt as slow as the sma.I try to find support/res. levels, breakouts, etc to find out the main trend, ie, is it advancing, declining , consolidating, basing, topping etc. then I try to identify medium term trends and decide when to buy and sell (or sell and buy, but I am yet to fill in the pmla form so i cant trade in F n O just yet) btw, I am a novice, just in case you are uncomfortable with taking advice from novices.  It worked pretty well for cipla, jp associates, etc in the fag end of the bull run of 2009- 2010. plus I've never lost more than 1 - 2%. I used to use oscillators, but price action and ma are better. It worked pretty well for cipla, jp associates, etc in the fag end of the bull run of 2009- 2010. plus I've never lost more than 1 - 2%. I used to use oscillators, but price action and ma are better.
|
|
| Back to top |
|
|
rrk2006hyd
Yellow Belt
Joined: 13 Oct 2010
Posts: 874
|
| Post: #12 Posted: Thu May 12, 2011 2:03 pm Post subject: |
|
|
thanks, rizzlybull, forums meant for sharing knowledge ..and anyone can give and take advices... and all are welcome here..thq
| grizzlybull wrote: | | rrk2006hyd wrote: | Helloo..Mr.grizzlybull,may i know what indicators u r using to find trends? and
thanks for giving replys |
I just first use the long term ma, anywhere between 100 to 200 days (or 20 week to 40 week) .. weighted ma is prefered, it isn't as fast as the ema and isnt as slow as the sma.I try to find support/res. levels, breakouts, etc to find out the main trend, ie, is it advancing, declining , consolidating, basing, topping etc. then I try to identify medium term trends and decide when to buy and sell (or sell and buy, but I am yet to fill in the pmla form so i cant trade in F n O just yet) btw, I am a novice, just in case you are uncomfortable with taking advice from novices. It worked pretty well for cipla, jp associates, etc in the fag end of the bull run of 2009- 2010. plus I've never lost more than 1 - 2%. I used to use oscillators, but price action and ma are better. |
|
|
| Back to top |
|
|
rrk2006hyd
Yellow Belt
Joined: 13 Oct 2010
Posts: 874
|
| Post: #13 Posted: Thu May 12, 2011 2:05 pm Post subject: |
|
|
JUST RIGHT CLICK UR MOUSE AND SELECT UP/DOWN ARROW ON UR CHART..AND CLICK ON WHERE U WANT TO PUT SIGNAL
| waynegonsalves88 wrote: | hi all,
rrk2006hyd....how do get the buy and sell indicators on the candlestick charts?? |
|
|
| Back to top |
|
|
|
|
You cannot post new topics in this forum
You cannot reply to topics in this forum
You cannot edit your posts in this forum
You cannot delete your posts in this forum
You cannot vote in polls in this forum
You can attach files in this forum
You can download files in this forum
|
Powered by phpBB © 2001, 2005 phpBB Group
|
|
|


