| View previous topic :: View next topic |
| Author |
Trading With Pivot Points |
ConMan
White Belt

Joined: 06 Aug 2008
Posts: 344
|
|
| Back to top |
|
 |
|
|
 |
kanna
White Belt

Joined: 03 Jan 2010
Posts: 91
|
Post: #92  Posted: Tue Nov 23, 2010 5:47 pm Post subject: Posted: Tue Nov 23, 2010 5:47 pm Post subject: |
 |
|
CP, I also use Pivot pts. with only one additional condition. if i am trading hourly charts, I will trade only long signals in pivot pts, when it is above 34 ema. and if it is below 34 ema , i will trade only short signals. this helps. Just a thought 
|
|
| Back to top |
|
 |
Ravi_S
Yellow Belt

Joined: 15 Jun 2009
Posts: 569
|
Post: #93  Posted: Tue Nov 23, 2010 7:19 pm Post subject: Posted: Tue Nov 23, 2010 7:19 pm Post subject: |
 |
|
Kanna,
This is an excellent strategy by itself... If you have a look at DMA, it reverses when the price goes below 34 ema and above 34 ema. So short when it's below 34 ema during a pullback and long when it's above 34 ema..
Regards
Ravi 
|
|
| Back to top |
|
 |
ConMan
White Belt

Joined: 06 Aug 2008
Posts: 344
|
Post: #94  Posted: Tue Nov 23, 2010 8:36 pm Post subject: Posted: Tue Nov 23, 2010 8:36 pm Post subject: |
 |
|
| Thanks Kanna and Ravi... It would be good if you can illustrate with examples.
|
|
| Back to top |
|
 |
kanna
White Belt

Joined: 03 Jan 2010
Posts: 91
|
Post: #95  Posted: Wed Nov 24, 2010 11:34 am Post subject: Posted: Wed Nov 24, 2010 11:34 am Post subject: |
 |
|
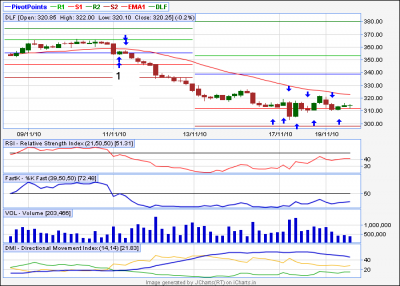
As per the strategy, we will buy when we get a green candle above PP with candle close below PP as Stop. Now in this DLF hourly chart attached , we would have go long in all the UP arrows and would have closed the longs with down arrows. ie, getting whip shawed.
If we follow, no buying below 34 ema, all this trades would have been avoided.
I am 100% sure that you are not going to trade like this , all signals. But may be for newbies like me it will be little difficult to choose signals. So i impose this myself
| Description: |
|
| Filesize: |
32.73 KB |
| Viewed: |
439 Time(s) |

|
|
|
| Back to top |
|
 |
kanna
White Belt

Joined: 03 Jan 2010
Posts: 91
|
Post: #96  Posted: Wed Nov 24, 2010 1:13 pm Post subject: Posted: Wed Nov 24, 2010 1:13 pm Post subject: |
 |
|
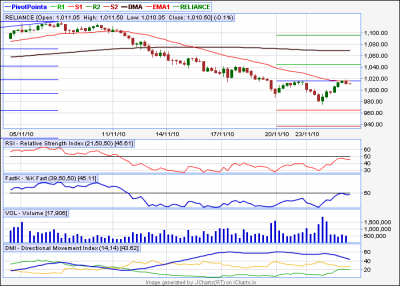
shorted reliance DEC future at 1024.75 . with stop of 10 pts. there are so many resistances at this level.
Weekly pivot
Hourly 34 EMA
Monthly support 1
50% retracement of last swing
Hence a try. If Stop hit and price closes above 34 we can try a long also
| Description: |
|
| Filesize: |
24.04 KB |
| Viewed: |
413 Time(s) |

|
|
|
| Back to top |
|
 |
kanna
White Belt

Joined: 03 Jan 2010
Posts: 91
|
Post: #97  Posted: Wed Nov 24, 2010 3:54 pm Post subject: Posted: Wed Nov 24, 2010 3:54 pm Post subject: |
 |
|
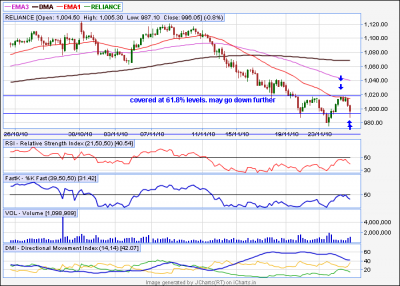
covered reliance for 25 pts profit as 61.8% fibo level achieved. will short again on a bounce back. My feeling is it will go to 963 levels
| Description: |
|
| Filesize: |
26.94 KB |
| Viewed: |
404 Time(s) |

|
|
|
| Back to top |
|
 |
ConMan
White Belt

Joined: 06 Aug 2008
Posts: 344
|
Post: #98  Posted: Wed Nov 24, 2010 4:31 pm Post subject: Posted: Wed Nov 24, 2010 4:31 pm Post subject: |
 |
|
Good Work Kanna
Keep posting more and more illustrations
|
|
| Back to top |
|
 |
kanna
White Belt

Joined: 03 Jan 2010
Posts: 91
|
Post: #99  Posted: Mon Nov 29, 2010 12:38 pm Post subject: Posted: Mon Nov 29, 2010 12:38 pm Post subject: |
 |
|
963 achieved and bounced back 
|
|
| Back to top |
|
 |
ConMan
White Belt

Joined: 06 Aug 2008
Posts: 344
|
Post: #100  Posted: Thu Dec 02, 2010 8:13 am Post subject: Posted: Thu Dec 02, 2010 8:13 am Post subject: |
 |
|
After tumultous last month ... lets hope for a good month with PP ....
The levels for Nifty are
R1 6248
PP 5988
S1 5626
We might be going around PP for a couple of days ... if we see a strong close today above PP we can go long....
Lets wait and watch

|
|
| Back to top |
|
 |
yawalkar
White Belt

Joined: 02 Oct 2010
Posts: 58
|
Post: #101  Posted: Thu Dec 02, 2010 8:28 am Post subject: Posted: Thu Dec 02, 2010 8:28 am Post subject: |
 |
|
| ChulbulPandey wrote: | DLF looking good in 60mins ...
Factors:
1. Close above S1 Weekly
2. Close above23.6% of the recent fall....
3. RSI Divergence
4. ADX above 50 ....
Hope this shoots ... Targets are
327-334-342-351-365 ...
Regards
  |
hi cp,
How you have setting 60min candles for long time frame?
I am able to view only for 2 days?
Can u help me?
|
|
| Back to top |
|
 |
ConMan
White Belt

Joined: 06 Aug 2008
Posts: 344
|
Post: #102  Posted: Thu Dec 02, 2010 8:33 am Post subject: Posted: Thu Dec 02, 2010 8:33 am Post subject: |
 |
|
Hi yawalkar
You see a small graph kind of option next to timeframe menu (daily/60mins/5min) ... in that please change the intraday setup to 25 days and then save the same by pressing 2nd button (floppy) on the left bottom
|
|
| Back to top |
|
 |
yawalkar
White Belt

Joined: 02 Oct 2010
Posts: 58
|
Post: #103  Posted: Thu Dec 02, 2010 8:54 am Post subject: Posted: Thu Dec 02, 2010 8:54 am Post subject: |
 |
|
| ChulbulPandey wrote: | Hi yawalkar
You see a small graph kind of option next to timeframe menu (daily/60mins/5min) ... in that please change the intraday setup to 25 days and then save the same by pressing 2nd button (floppy) on the left bottom |
Thanks a lot brother..
|
|
| Back to top |
|
 |
ravionlinek
White Belt

Joined: 11 Jun 2010
Posts: 97
|
Post: #104  Posted: Thu Dec 02, 2010 9:09 am Post subject: Posted: Thu Dec 02, 2010 9:09 am Post subject: |
 |
|
ChulbulPandey sir
LT dekha kya can we go for 2150
|
|
| Back to top |
|
 |
ConMan
White Belt

Joined: 06 Aug 2008
Posts: 344
|
Post: #105  Posted: Thu Dec 02, 2010 9:29 am Post subject: Posted: Thu Dec 02, 2010 9:29 am Post subject: |
 |
|
Hi Ravi
A close above 2029 today EoD can give us an upside of 5% ... its already trading above R1 weekly....
Regards

|
|
| Back to top |
|
 |
|

