| View previous topic :: View next topic |
| Author |
TREND FOLLOWING |
svkum
White Belt

Joined: 14 Feb 2007
Posts: 321
|
Post: #1  Posted: Sat Dec 03, 2011 11:38 pm Post subject: TREND FOLLOWING Posted: Sat Dec 03, 2011 11:38 pm Post subject: TREND FOLLOWING |
 |
|
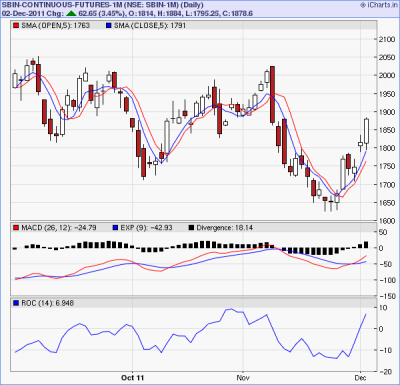
HH/HL -LH/LL TREND CATCHING
| Description: |
|
| Filesize: |
35.67 KB |
| Viewed: |
626 Time(s) |
|
|
|
| Back to top |
|
 |
|
|
 |
svkum
White Belt

Joined: 14 Feb 2007
Posts: 321
|
Post: #2  Posted: Sat Dec 03, 2011 11:43 pm Post subject: Posted: Sat Dec 03, 2011 11:43 pm Post subject: |
 |
|
TREND FOLLOWING STRATEGY
PLOT 5SMA OPEN
5SMA CLOSE
INSTEAD OF FOLLOWING NORMAL EMA CROSSOVER , FOLLOW 5SMA OPEN AND 5SMA CLOSE CROSSOVER.
ALSO PLOT PARSAR FOR CONFIRMATION AS WELL AS FOR SL.
SBIN CHART IS SELF EXPLAINATORY.
|
|
| Back to top |
|
 |
svkum
White Belt

Joined: 14 Feb 2007
Posts: 321
|
Post: #3  Posted: Sat Dec 03, 2011 11:52 pm Post subject: Posted: Sat Dec 03, 2011 11:52 pm Post subject: |
 |
|
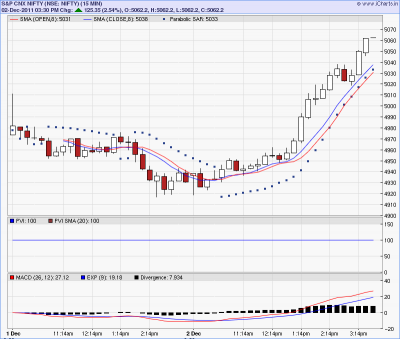
Above strategy can be applied for intraday -2 days -15tf
entry exit at crossover of 5sma open and 5sma close'
| Description: |
|
| Filesize: |
31.13 KB |
| Viewed: |
641 Time(s) |
|
|
|
| Back to top |
|
 |
svkum
White Belt

Joined: 14 Feb 2007
Posts: 321
|
Post: #4  Posted: Sat Dec 03, 2011 11:56 pm Post subject: Posted: Sat Dec 03, 2011 11:56 pm Post subject: |
 |
|
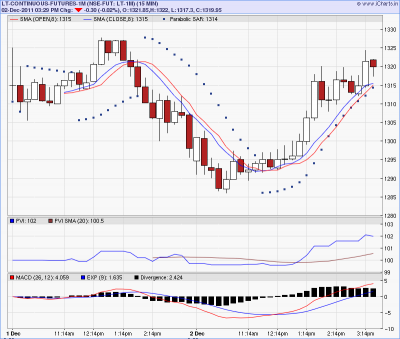
LT INTRADAY CHART
neat and clean entry exit.
| Description: |
|
| Filesize: |
38.24 KB |
| Viewed: |
583 Time(s) |
|
|
|
| Back to top |
|
 |
svkum
White Belt

Joined: 14 Feb 2007
Posts: 321
|
Post: #5  Posted: Sun Dec 04, 2011 12:04 am Post subject: Posted: Sun Dec 04, 2011 12:04 am Post subject: |
 |
|
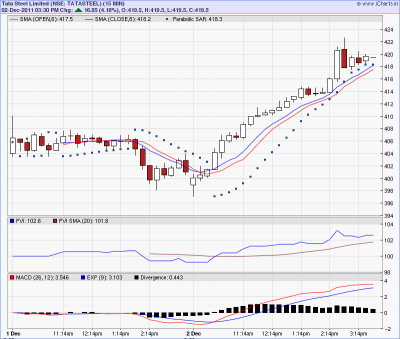
TATA STEEL CHART AGAIN CLEAR ENTRY EXIT .
| Description: |
|
| Filesize: |
35.37 KB |
| Viewed: |
601 Time(s) |
|
|
|
| Back to top |
|
 |
sonila
Brown Belt

Joined: 04 Jun 2009
Posts: 1786
|
Post: #6  Posted: Sun Dec 04, 2011 9:32 am Post subject: Posted: Sun Dec 04, 2011 9:32 am Post subject: |
 |
|
| Good yet simple strategy. I will try.
|
|
| Back to top |
|
 |
girishhu1
White Belt

Joined: 17 Aug 2009
Posts: 316
|
Post: #7  Posted: Sun Dec 04, 2011 9:49 am Post subject: Posted: Sun Dec 04, 2011 9:49 am Post subject: |
 |
|
hi svkum,
nice strategy
can you pl explain the logic of sma(close,5) and sma(open,5) crossover?
any alternative to parsar based s/l?
regards,
girish
|
|
| Back to top |
|
 |
vinay28
Black Belt

Joined: 24 Dec 2010
Posts: 11748
|
Post: #8  Posted: Sun Dec 04, 2011 10:20 am Post subject: Posted: Sun Dec 04, 2011 10:20 am Post subject: |
 |
|
| svkum, what about rangebound and volatile market, which is most of the time? Too many whipsaws?
|
|
| Back to top |
|
 |
svkum
White Belt

Joined: 14 Feb 2007
Posts: 321
|
Post: #9  Posted: Sun Dec 04, 2011 12:08 pm Post subject: Posted: Sun Dec 04, 2011 12:08 pm Post subject: |
 |
|
Charts which are displayed are with 8sma open and 8sma close.
also we can use 5sma open and 5sma close.
1) principle used in this strategy is
bullish candle presents high close than open and vice versa
so automatically trend is displayed accordingly .
we can assume at cross ,with confirmation , trend reversal is taking place.
2) for ppl watching terminal exit at cross is ok , otherwise sl shd be as per parsar .
3) any other sl strategy for this plan are welcome.
4) This is trend following strategy , may not work in sideways mkt , so the more diff bet 2 smas the more strong trend , narrower the diff bet smas weak trend .
|
|
| Back to top |
|
 |
GHAISAS
White Belt

Joined: 01 Feb 2010
Posts: 349
|
Post: #10  Posted: Sun Dec 04, 2011 12:40 pm Post subject: Posted: Sun Dec 04, 2011 12:40 pm Post subject: |
 |
|
svkum sir, thanks for the strategy - interesting!
SBI - 1st chart - Daily - how can be plot on the Live Charts Premium. Maximum time frame allowed is 60 minutes on Live Charts Premium. Kindly guide how should I proceed for 5 min SMA Open & close for daily.
Kind regards, ghaisas.
|
|
| Back to top |
|
 |
svkum
White Belt

Joined: 14 Feb 2007
Posts: 321
|
Post: #11  Posted: Sun Dec 04, 2011 2:37 pm Post subject: Posted: Sun Dec 04, 2011 2:37 pm Post subject: |
 |
|
GHAISAS ,
PL SEE CHARTS (PREMIUM) , 6TH FROM TOP OF LIST
|
|
| Back to top |
|
 |
GHAISAS
White Belt

Joined: 01 Feb 2010
Posts: 349
|
Post: #12  Posted: Sun Dec 04, 2011 5:40 pm Post subject: Posted: Sun Dec 04, 2011 5:40 pm Post subject: |
 |
|
| svkum, thanks for pinpointing - right under my nose. sorry for trouble.
|
|
| Back to top |
|
 |
svkum
White Belt

Joined: 14 Feb 2007
Posts: 321
|
Post: #13  Posted: Tue Dec 06, 2011 6:36 pm Post subject: Posted: Tue Dec 06, 2011 6:36 pm Post subject: |
 |
|
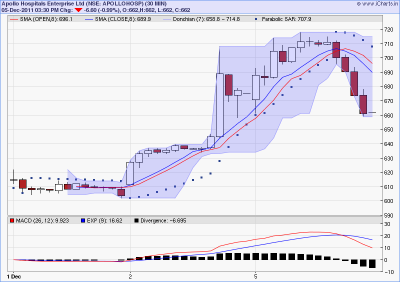
30TF chart shows clear entry/exit signals
| Description: |
|
| Filesize: |
35.63 KB |
| Viewed: |
555 Time(s) |
|
|
|
| Back to top |
|
 |
svkum
White Belt

Joined: 14 Feb 2007
Posts: 321
|
Post: #14  Posted: Tue Dec 06, 2011 6:39 pm Post subject: Posted: Tue Dec 06, 2011 6:39 pm Post subject: |
 |
|
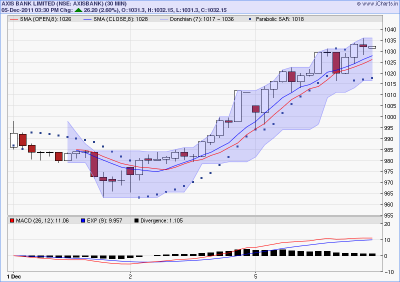
axis bank .
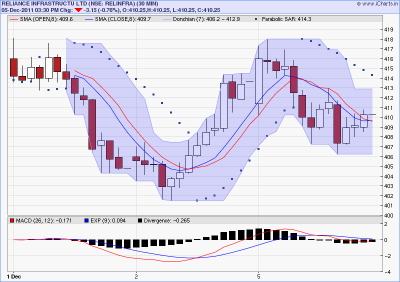
now i have combined donchains strategy with 8ema open /8ema close strategy , which gives comfortable entry exit points
| Description: |
|
| Filesize: |
34.56 KB |
| Viewed: |
519 Time(s) |
|
|
|
| Back to top |
|
 |
svkum
White Belt

Joined: 14 Feb 2007
Posts: 321
|
Post: #15  Posted: Tue Dec 06, 2011 6:44 pm Post subject: Posted: Tue Dec 06, 2011 6:44 pm Post subject: |
 |
|
rel infra chart
| Description: |
|
| Filesize: |
44.13 KB |
| Viewed: |
508 Time(s) |
|
|
|
| Back to top |
|
 |
|

