|
|
| View previous topic :: View next topic |
| Author |
Weekly Update For Nifty,Markets |
pradeepgolfer
White Belt

Joined: 16 Sep 2009
Posts: 212
|
Post: #1  Posted: Sun Aug 08, 2010 10:12 am Post subject: WEEKLY UPDATE FOR NIFTY,MARKETS Posted: Sun Aug 08, 2010 10:12 am Post subject: WEEKLY UPDATE FOR NIFTY,MARKETS |
 |
|
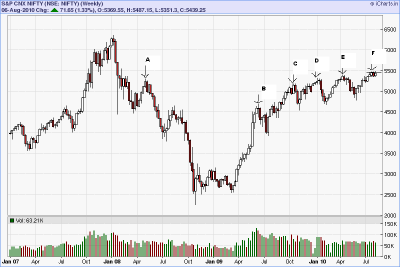
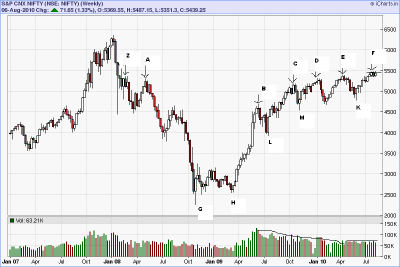
The chart is of NIFTY SPOT WEEKLY.
Notice first that the pivot marked A,5298.85,(5271, NF level), has been providing resistance to the nifty upmove, from October 2009 to present time.Once the NIFTY crossed the pivot high marked C,(5165 NF level) there was an immediate reaction down.Again, when NIFTY crossed the pivot marked D,(5303 NF level), there was a similar reaction which,however, made a higher low.THe Nifty again crossed the pivot high marked E,(5398,NF level) but this time, there was no reaction but a tight trading range, of 4 weeks, around the pivot point marked E, resulted.
Note this trading range has been above the weekly pivot A, for four weeks.This weekly pivot A, has provided resistance to the NIFTY for 9 months.
This is a fact,not an opinion or gut feel.This trading range is an abrupt departure from the behaviour of the NIFTY during the 9 months, preceding July.
I can only suggest two reasons for this happening.The sudden disappearance of downward reactions, suggests that the bears have withdrawn from the market and stopped the aggressive selling, evidenced earlier.THe second reason, is that the bulls have absorbed the agrresive selling, which has led to a trading range.The first reason suggests downward risk is limited to the extent of the trading range low.The second reason suggests that the bulls are in control and opens up the possibility of significant upside leading to an eventual test of all time high.
A retest of the 5349 level is technically possible, though the Dow recovery and closing well ofF the lows, makes it a very low probabilty event.But I cannot rule it out totally.
A clear break of the NIFTY SPOT LEVEL OF 5300 WILL SET UP A TEST OF THE 4700 LEVEL ON THE SPOT.
The DOW on the weekly charts has had a weekly close near the high of the week above the weekly pivot high of 10594.20.The next weekly pivot high is 11258.Since the DOW, has been up the last 4 weeks out of 5, a test of that high is highly probable in the coming weeks.
The DOW on the daily charts, on Friday, recovered 138 points off the low,in spite of very bad news, clearly indicating DOW is in strong hands.A test of 10920 is, therefore, a high probaility or even a certain one.
All of the above suggests that a positional trade, with a stop of below 5349 or better below 5300, is a low risk one. All positional shorts should be reversed above 5487.
A good stop for a long NIFTY FUTURES intraday trade is 5420-5418 (NF level)
| Description: |
|
| Filesize: |
17.58 KB |
| Viewed: |
502 Time(s) |
|
|
|
| Back to top |
|
 |
|
|  |
tdadvait
White Belt

Joined: 03 Aug 2009
Posts: 8
|
Post: #2  Posted: Sun Aug 08, 2010 12:53 pm Post subject: Posted: Sun Aug 08, 2010 12:53 pm Post subject: |
 |
|
| very well explained sir. Thank you.
|
|
| Back to top |
|
 |
ridinghood
Yellow Belt

Joined: 16 Apr 2009
Posts: 724
|
Post: #3  Posted: Sun Aug 08, 2010 9:30 pm Post subject: Posted: Sun Aug 08, 2010 9:30 pm Post subject: |
 |
|
| thnx pg
|
|
| Back to top |
|
 |
pradeepgolfer
White Belt

Joined: 16 Sep 2009
Posts: 212
|
Post: #4  Posted: Sun Aug 08, 2010 9:46 pm Post subject: Posted: Sun Aug 08, 2010 9:46 pm Post subject: |
 |
|
ridinghood
tdadvait
I do not trade in NF but it is because of the encouragement of friends like you that I take considerable pains to analyse and post.
THank you from the bottom of my heart
|
|
| Back to top |
|
 |
rrsekhar
White Belt

Joined: 21 Feb 2010
Posts: 196
|
Post: #5  Posted: Mon Aug 09, 2010 8:17 am Post subject: Posted: Mon Aug 09, 2010 8:17 am Post subject: |
 |
|
| thanx pradeep.
|
|
| Back to top |
|
 |
pradeepgolfer
White Belt

Joined: 16 Sep 2009
Posts: 212
|
Post: #6  Posted: Mon Aug 09, 2010 5:23 pm Post subject: Posted: Mon Aug 09, 2010 5:23 pm Post subject: |
 |
|
sekhar
welcome
|
|
| Back to top |
|
 |
jitesh7
White Belt

Joined: 24 Dec 2009
Posts: 24
|
Post: #7  Posted: Mon Aug 09, 2010 9:53 pm Post subject: Posted: Mon Aug 09, 2010 9:53 pm Post subject: |
 |
|
Hi Pradeep,
If you see the volume, that is decreasing(which is forming negetive divergence). How you are seeing it.
I am new in technical so just asking this doubt.
Thanks
Jitesh
|
|
| Back to top |
|
 |
pradeepgolfer
White Belt

Joined: 16 Sep 2009
Posts: 212
|
Post: #8  Posted: Tue Aug 10, 2010 1:54 am Post subject: Posted: Tue Aug 10, 2010 1:54 am Post subject: |
 |
|
JITESH
I am very happy that you have had the guts to confront me, with this basic tenet of technical analysis, which is indicating the opposite, of what I have stated in the post. I also congratulate you, for the desire to learn and for the humble declaration, that you are new to technical analysis.
Your observation that volume is decreasing is a correct one. You have concluded that negative divergence is taking place and this means that the nifty spot is moving up with decreasing volume and so is bearish. This is what, most or all books, will tell you.
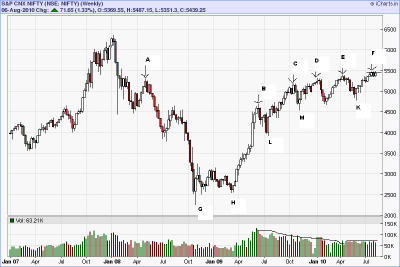
The reality is never so simple. Traders talk about volume, without understanding why the volume is generated, in the first place. Volume represents the number of transactions that have been completed. If volume is decreasing, traders are transacting less and less. If traders are transacting less why is that so? Traders may withdraw, because of some doubt, about the direction of market. If traders withdraw, then the market will enter the consolidation phase. Less volume- less transactions - cause consolidations. Books will tell you consolidations, take place with lower volume, when in reality, it is low volume-trader withdrawal-that causes consolidation. On the chart after the fall AG, the decreasing volume caused the consolidation to take place and this is marked GH.
HB marked a steep rally. Volume peaked and after that volume began a steady decline from point B to point E. This BE phase is the consolidation phase. From E to point F the volume was steady and constant, at a lower level. That the volume was not decreasing, but constant, was a hint that the consolidation phase was over and that a steady participation of traders was evident.
I have called BCDE a consolidation. You have interpreted it as an uptrend. In technical analysis interpretation is everything. If BCDE was an uptrend, as you suggested because of the higher highs and higher lows, then negative divergence has taken place.
Volume, was one reason, I called BCDE a consolidation. The second reason, is evident if you compare the rally HB, to the rallies that followed it, such as LC or MD. It is clearly visible to the naked eye, that these rallies, are considerably less steep than HB and may be considered a consolidation or correction. A correction or consolidation is a decrease in the movement of the market, up or down. This conclusion is supported by the action of volume. Such a correction is known as a "running correction".
| Description: |
|
| Filesize: |
17.74 KB |
| Viewed: |
454 Time(s) |
|
|
|
| Back to top |
|
 |
tdadvait
White Belt

Joined: 03 Aug 2009
Posts: 8
|
Post: #9  Posted: Tue Aug 10, 2010 10:39 pm Post subject: Posted: Tue Aug 10, 2010 10:39 pm Post subject: |
 |
|
Pradeepgolfer, again thanks for detailed explaination.I have never seen such explaination from anybody before.  
|
|
| Back to top |
|
 |
pradeepgolfer
White Belt

Joined: 16 Sep 2009
Posts: 212
|
Post: #10  Posted: Sat Aug 14, 2010 7:22 am Post subject: Posted: Sat Aug 14, 2010 7:22 am Post subject: |
 |
|
I have mentioned pivots in the discussion below;what are pivots?
A calculated pivot, often called a floor trader pivot, is derived from a formula using the previous day's high, low and closing price. The result is a focal price level about which price action is likely to turn, either up or down.Calculated pivots represent potential turning points in price, while price pivots are actual historic turning points.
Price pivots are not calculated. The pivot is defined by the structural relationship between price bars. Price pivots form on all time frames, are building blocks of trend and provide objective entry and exit points for trading.
Everyone should read this about pivots here: http://www.investopedia.com/articles/trading/07/pivots.asp
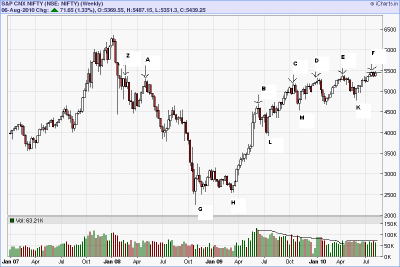
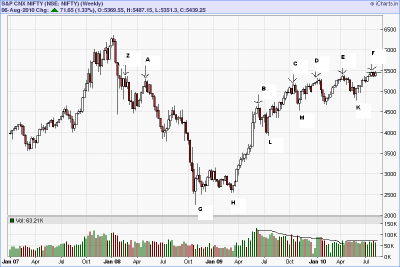
On the NIFTY spot trading has been taking place above the weekly price pivot of 5368,marked z on the chart, for 4 weeks now.The corresponding weekly pivot on NIFTY futures is 5450 and NF has been trading below this level of 5450 for 4 weeks.Because of this it is reasonable to call this a resistance level.However notice that since it has been trading in a comparatively tight range for 4 weeks and this shows that there is no rejection from this level and NF finally had a weekly close above this pivot,this can only be taken as a bullish sign.
| Description: |
|
| Filesize: |
17.87 KB |
| Viewed: |
459 Time(s) |
|
| Description: |
|
| Filesize: |
17.87 KB |
| Viewed: |
450 Time(s) |
|
|
|
| Back to top |
|
 |
ridinghood
Yellow Belt

Joined: 16 Apr 2009
Posts: 724
|
Post: #11  Posted: Sat Aug 14, 2010 7:18 pm Post subject: Posted: Sat Aug 14, 2010 7:18 pm Post subject: |
 |
|
dear pg
going through ur posts r proving to be a great learning experience.
thnx for ur nifty guidance. we always look forward to ur posts !
regs
ridinghood
|
|
| Back to top |
|
 |
pradeepgolfer
White Belt

Joined: 16 Sep 2009
Posts: 212
|
Post: #12  Posted: Sat Aug 14, 2010 9:25 pm Post subject: Posted: Sat Aug 14, 2010 9:25 pm Post subject: |
 |
|
| glad to be of help-please ask any questions; that would benefit every body.
|
|
| Back to top |
|
 |
pradeepgolfer
White Belt

Joined: 16 Sep 2009
Posts: 212
|
Post: #13  Posted: Sun Aug 15, 2010 7:41 am Post subject: WHY WEEKLY INDICATOR DIVERGENCE SHOULD BE IGNORED Posted: Sun Aug 15, 2010 7:41 am Post subject: WHY WEEKLY INDICATOR DIVERGENCE SHOULD BE IGNORED |
 |
|
I have seen many traders point out that on NIFTY weekly charts, there has been indicator divergences for a long time and because of this NIFTY will fall.Let me explain why this divergence,in this particular case, should be ignored.
An indicator compares the present with the past and the exact period, in the past, may be specified or adjusted by the trader-default for rsi is 14.
The only advantage with an indicator is that it gives exact numerical references to increasing momentum or decreasing momentum.A trend, in which momentum is decreasing is supposedly a bearish condition,though many times it is a temporary bearish condition,as in a consolidation.
It is obvious that if the present is compared with the past and the both are same, as it will be in a trading range, the indicator will not show any divergence. An indicator will show continuous divergences only in a trend.
Since a trend has many decreases in momentum,the indicator during the life of a trend,will show divergence,quite often.
If you refer to the NIFTY weekly chart posted below, the steep fast rally marked HB,is followed by three higher highs (HH) and higher lows (HL).This is a definition of a trend.But it is a weak trend, since each HH only just breaks the previous high, by a small amount.Compared to the rally HB, it is a terrribly weaker trend.You can see this by the naked eye.The indicator will also see this and immediately shout out a warning, in the form of a divergence-it is doing it's job.
IF SOMEBODY IS SHOUTING AN OPINION IT IS ALWAYS PRUDENT TO ASK WHY
Now a loss of momentum or correction of a trend can manifest itself on the charts, in the form of a sharp fall or in the form of a tight range.A tight range is more bullish than a fall, since the tight range means even the bears are not aggressively selling and when even bears are bullish...it is a clear sign of extreme bullishness.A loss of momentum which manifests itself in the form of a weak trend,weaker than the sharp trend which preceded it,is the most bullish of all corrections since the profit booking and bear raids for the last one year, has not been able to reverse the trend even temporarilly and has only managed to weaken it.
Short selling, at this stage is, therefore,...simply suicide.
| Description: |
|
| Filesize: |
17.87 KB |
| Viewed: |
436 Time(s) |
|
|
|
| Back to top |
|
 |
pradeepgolfer
White Belt

Joined: 16 Sep 2009
Posts: 212
|
Post: #14  Posted: Sat Aug 21, 2010 1:44 pm Post subject: Posted: Sat Aug 21, 2010 1:44 pm Post subject: |
 |
|
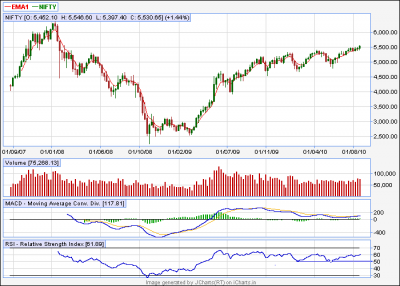
The weekly chart of NIFTY SPOT shows no weakness in price or indicator.Though the rsi showed some negative divergence for sometime,it bounced off the 50 level not only once but twice and now is confirming the uptrend.
MACD been warning of decreasing momentum but is still above the zero line.
Positional shorts continue to be suicide,as in the last weekly update. Positional longs should be continued to be held with a stop.
| Description: |
|
| Filesize: |
13.52 KB |
| Viewed: |
411 Time(s) |
|
|
|
| Back to top |
|
 |
seshareddy
White Belt

Joined: 06 Jan 2009
Posts: 95
|
Post: #15  Posted: Sat Aug 21, 2010 2:03 pm Post subject: shorts sucide ? ha ha Posted: Sat Aug 21, 2010 2:03 pm Post subject: shorts sucide ? ha ha |
 |
|
hi pradeep
you are correct in theory side let us c practically i was with shorts but i go pos longs from 5474 or 5425
|
|
| Back to top |
|
 |
|
|
You cannot post new topics in this forum
You cannot reply to topics in this forum
You cannot edit your posts in this forum
You cannot delete your posts in this forum
You cannot vote in polls in this forum
You can attach files in this forum
You can download files in this forum
|
Powered by phpBB © 2001, 2005 phpBB Group
|
|
|

