|
|
| View previous topic :: View next topic |
| Author |
What Is Technical Analysis |
pradeepgolfer
White Belt

Joined: 16 Sep 2009
Posts: 212
|
Post: #16  Posted: Sat Aug 14, 2010 10:26 am Post subject: Posted: Sat Aug 14, 2010 10:26 am Post subject: |
 |
|
I should say again that I am not writing this because I am an expert.I too am learning.Experts do not give reasons or try to make it an educational experience.This is to encourage traders to learn and analyse using simple but powerful techniques which do not depend on interpretation but on charts facts, which can be noticed on the chart itself.I make mistakes and yesterday was one mistake.However I try to recognise my mistake admit it and then make sure I do not make the same mistake again.
How to determine trend? In a particular chart if you can see it moving in one direction that is the trend.Trends are very easy to see and traders generally judge correctly, the direction of the trend.Most novices believe that if you know the direction of the trend it is sufficient to make money- why then do 90% of traders lose money? Because they do not realise that position management is more important than knowing trend.
How to manage your position? If you cant measure it, you cant manage it-Ed Seykota An indicator is essentially a measuring device but it depends a lot on interpretation.Price pivots also measure or define a trend and it's turning points.A novice will find price pivots easy to grasp because there is no interpretation or experience needed to apply it.I suggest all novices and even experienced traders, who want simplicity in their analysis, to concentrate on price pivots.
I said my basic strategy is to define the trend as a series of higher highs and higher lows or lower highs and lower lows.Now a novice may wonder how to define a low or a high.A pivot high or pivot low is the best way.
what are pivots?
A calculated pivot, often called a floor trader pivot, is derived from a formula using the previous day's high, low and closing price. The result is a focal price level about which price action is likely to turn, either up or down.Calculated pivots represent potential turning points in price, while price pivots are actual historic turning points.
Price pivots are not calculated. The pivot is defined by the structural relationship between price bars. Price pivots form on all time frames, are building blocks of trend and provide objective entry and exit points for trading.
Everyone should read this about pivots here: http://www.investopedia.com/articles/trading/07/pivots.asp
|
|
| Back to top |
|
 |
|
| |
pradeepgolfer
White Belt
Joined: 16 Sep 2009
Posts: 212
|
| Post: #17 Posted: Sun Aug 15, 2010 9:39 pm Post subject: my strategy in steps |
|
|
I will try and outline my strategy in steps
1. See by observation or by eyes, if you can see a security going up or down.If you can notice a movement up or down then there is a trend in that direction in that time frame.To trade that is all you need to know.
The rest is management of position
2.Novices start your trading with one time frame only.
Try to identify the price pivot highs and lows.Go to this link to understand what price pivots are:
http://www.investopedia.com/articles/trading/07/pivots.asp
If there are higher pivot highs and higher pivot lows, go long.For short opportunities see if there are lower high and lower lows.See as many charts as possible before starting trading to get idea of the pivots and how they are positioned near bottoms and near tops so that you can recognise weakening and reversal of both uptrends and downtrends.Notice especially distance between the consecutive pivot highs or lows-if 3 pivot are made close together then the reversal may be near.
3.Put a stop below one of the pivot lows.Which pivot low you put the stop below depends on the past behaviour, volatility and choppiness of the security.In natural gas a much larger stop is needed than in copper.In crude, a larger stop is needed than in copper.Also I try to put a stop below a pivot low of the previous day, whenever possible, since for that stop to trigger there has to be a cosiderable fall and that makes it expensive for the operator to do a stop run.
4.To start with aim for a target just above the nearest pivot high.Sometimes that nearest pivot high will be far or sometimes close.See if you are happy with the reward associated with the target-then take the trade.
5. Once you are making money in one time frame then you may begin checking more time frames.If you see too many time frames too early you will get confused.I start with the daily then the 60 min then 20 min and last the 5 min.Look for the pivot points.I prefer pivot points rather than moving averages to identify trend.Also it is not clear which period moving average to use but pivot points in a particular time frame are fixed and so this is a big advantage for novices.
A novice can start with these simple 5 steps and make money.An experienced trader may also incorporate pivots into his own favourite strategy beacuse of it 's simplcity.
|
|
| Back to top |
|
|
nareshusv
White Belt
Joined: 20 Sep 2009
Posts: 65
|
| Post: #18 Posted: Sun Aug 15, 2010 10:18 pm Post subject: |
|
|
Dear Pradeep,
It is good to read your article. I understand so much of experience behind it.
My request is that explain with the charts, so that we understand better.
Once again thanks for your posts.
regards
Naresh 
|
|
| Back to top |
|
|
pradeepgolfer
White Belt
Joined: 16 Sep 2009
Posts: 212
|
| Post: #19 Posted: Mon Aug 16, 2010 5:07 am Post subject: |
|
|
nareshusv
your need is my pleasure-I have sterted doing what you have suggested and you will find a number of explanations with charts very soon.Watch this space
|
|
| Back to top |
|
|
pradeepgolfer
White Belt
Joined: 16 Sep 2009
Posts: 212
|
| Post: #20 Posted: Mon Aug 16, 2010 5:14 am Post subject: WHY USE PRICE PIVOTS |
|
|
For meaning of price pivots
http://www.investopedia.com/articles/trading/07/pivots.asp
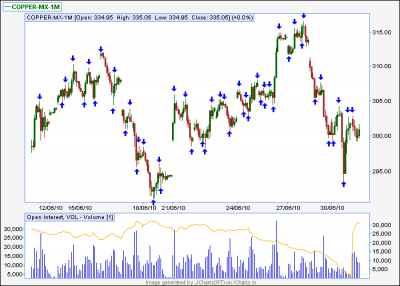
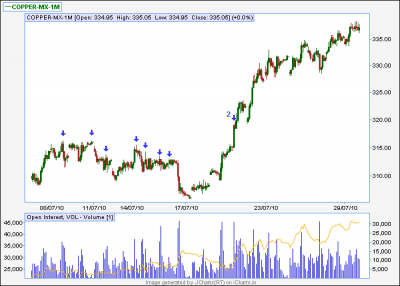
I have marked all the price pivots on the chart.The up arrows mark pivot lows and down arrows mark pivot highs.
On the left side and the right side of the chart there is clear progression of lower highs and lower lows.This is a downtrend.
What about the middle of the chart? A mess! Confusion!
Why use pivots then you may ask? Why not moving averages,macd, rsi,volume...? All these have to be calculated which is no problem since icharts software will do that for you. Yes icharts rocks!! All you have to decide is the period of the indicator-do you use 2 periods or 5 periods or 7 periods 20 periods 50 periods or 200 periods? So what do you have in the middle of the head? A mess! confusion!
Confusion in the charts is better than confusion in the mind. If you use 7 period and make a loss, the loss is because you used 7 period.So you try 20 period and, if you make a loss, as eventualy all traders do, it is because the wrong period was used.Soros uses 50 period so the mistake was not in using 50 period.Eventually you will blow your account and your mind!
A price pivot does not ever change or need to be calculated.It is decided by the market,not by some Nobel prize winner, who wants to show how smart he is.I am in the market to make money,not to show how smart I am.
| Description: |
|
| Filesize: |
13.78 KB |
| Viewed: |
592 Time(s) |
|
|
|
| Back to top |
|
|
pradeepgolfer
White Belt
Joined: 16 Sep 2009
Posts: 212
|
| Post: #21 Posted: Mon Aug 16, 2010 6:05 am Post subject: |
|
|
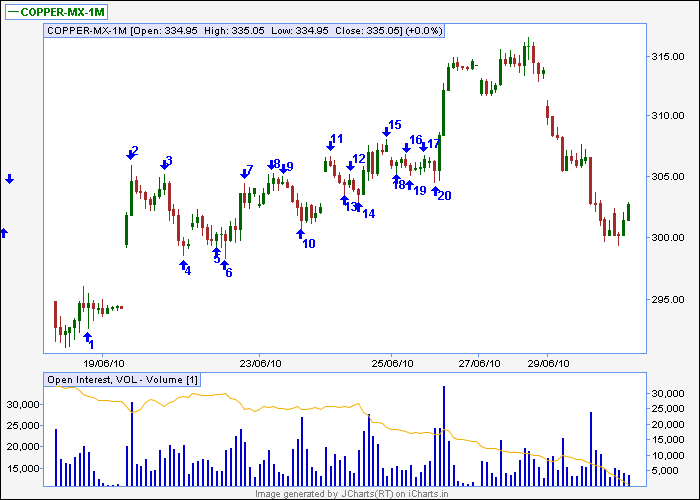
I want to concentrate on the confusion reffered to in the middle of the chart,in the last post.All the PIVOTS are marked 1 TO 20.The rally from pivot 1 to 2 consolidated and pivots 3 to 10 remained inside pivots 1 & 2.Pivot 11 broke pivot 2 by 2 ticks and fell to pivot 14 also filing the gap.Pivot 15 was higher than pivot 11 and pivot 20 was a higher low. At this point there were two higher highs and higher lows and enough justification to take a long position.This conclusion is supported by the strong rally which took place from pivot 1 to pivot 2.
The big green bar afer pivot 20 broke pivot 15 and even an entry there would have made you 6 rs conservatively.
If you had noticed that pivot lows 18 19 and 20, traded above pivot highs 2,7,8 and 9 for almost all the time,a long position would have been definitely suggested by market action alone.
| Description: |
|
| Filesize: |
11.61 KB |
| Viewed: |
2453 Time(s) |
|
Last edited by pradeepgolfer on Wed Aug 18, 2010 6:01 am; edited 1 time in total |
|
| Back to top |
|
|
pradeepgolfer
White Belt
Joined: 16 Sep 2009
Posts: 212
|
| Post: #22 Posted: Mon Aug 16, 2010 6:25 am Post subject: |
|
|
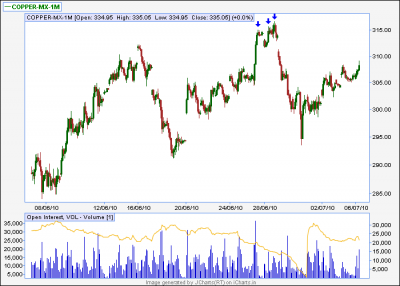
The three pivot highs marked are close together showing not much followthrough after a sharp climatic rally.A sell is clearly suggested.
| Description: |
|
| Filesize: |
14.02 KB |
| Viewed: |
586 Time(s) |
|
|
|
| Back to top |
|
|
pradeepgolfer
White Belt
Joined: 16 Sep 2009
Posts: 212
|
| Post: #23 Posted: Mon Aug 16, 2010 9:15 am Post subject: |
|
|
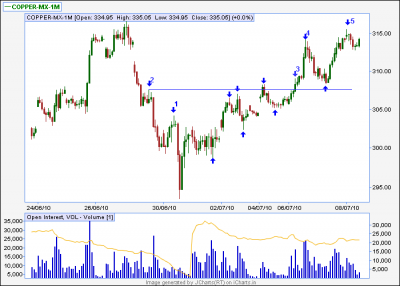
The first bullish sign is the big green candle at the bottom of the chart.The next bullish sign was when pivot 1 was taken out and a higher low made.Further confirmation,if needed, was provided when the pivot 2 was taken out by bar marked 3.Entering at the close of the bar marked 3 would have given rs 7 as profit since the target was the high of the preceding downswing.
This is only with use of pivots and nothing else
| Description: |
|
| Filesize: |
12.07 KB |
| Viewed: |
593 Time(s) |
|
|
|
| Back to top |
|
|
pradeepgolfer
White Belt
Joined: 16 Sep 2009
Posts: 212
|
| Post: #24 Posted: Mon Aug 16, 2010 9:28 am Post subject: |
|
|
An entry on the close of the bar marked 2, after bar 2 took out the highs of all the pivot highs, marked by blue arrows, would still have yielded good profit.
| Description: |
|
| Filesize: |
14.74 KB |
| Viewed: |
632 Time(s) |
|
|
|
| Back to top |
|
|
aromal
White Belt
Joined: 22 Mar 2010
Posts: 302
|
| Post: #25 Posted: Mon Aug 16, 2010 10:31 am Post subject: |
|
|
| pradeepgolfer wrote: | The first bullish sign is the big green candle at the bottom of the chart.The next bullish sign was when pivot 1 was taken out and a higher low made.Further confirmation,if needed, was provided when the pivot 2 was taken out by bar marked 3.Entering at the close of the bar marked 3 would have given rs 7 as profit since the target was the high of the preceding downswing.
This is only with use of pivots and nothing else |
thanks for posting wonderful things
|
|
| Back to top |
|
|
pradeepgolfer
White Belt
Joined: 16 Sep 2009
Posts: 212
|
| Post: #26 Posted: Mon Aug 16, 2010 3:09 pm Post subject: |
|
|
| Technical analysis need not be technical or analysis-it can be simple observation.
|
|
| Back to top |
|
|
pradeepgolfer
White Belt
Joined: 16 Sep 2009
Posts: 212
|
| Post: #27 Posted: Wed Aug 18, 2010 5:15 am Post subject: |
|
|
Questioning is analysis. Analysis leads to knowledge.Knowledge leads to power.But power is not benefit.Management of power leads to benefit.
Analysis of an indicator-moving averages,macd,rsi volume- will give a trader knowledge (about the security).Is it overbought or oversold,for instance.Management of that information or knowledge will lead to benefit.
I am asked what indicators to use and when I say use anything which will give knowledge,the questioner normally nods blankly and thinks I am a madman and hurries to ask some other trader, who promptly tell him to use moving averages of 8.567 periods and test it on 100 securities and if it does not work, then try a moving average of 19.95367 periods.The result of that analysis is a lot of knowledge but no benefit.
When I see a chart I ask questions.Questions form the basis of all analysis-is the security trending or in a range.?In which time frames is it trending and which time frames is it in a range.A range on the weekly will be a strong trend on the 5 min.Is the trend up or down?In which time frames is it up and in which is it down? If it is up on 60 min 20 min and down in 5 min,where is the benefit or the opportunity for benefit?.
One benefit, is you can use 5 min chart for entry, once it show bottoming signs, and get a better price.And benefit from a move in the 60 min time frame,which will be longer, than a move in the 5 min time frame.THe other benefit is shorting in the 5 min and reverse once the security is bottoming out.This short may be for a smaller move because of the smaller time frame, if the trend of the shorter time frame, is different from the trend,in the longer time frame.
What is bottoming out? This is the process whereby the stock stops going down or rejects the downside.Watching for rejection is the simplest,most powerful indication that a security does not want to go in a particular direction- it must, thererfore, eventually go in the opposite direction.The key word is eventually and you must take the time frame into consideration to know when and how far it may go in the opposite direction.
Which time frames to see?
Here too the idea is to get benefit from the knowledge seeing different time frames will give,and there should be some differnce in the time frames chosen.There is little point in seeing 1 min 2 min and 3 min because all may give similar knowledge or information.A balance is required and a suggestion is 5min 20 min 60min daily and weekly.If you are a intraday player and seeing so many time frames does not suggest anything, then check the 5 min only for a trade.The benefit in checking many time frames is to see if they are in the same trend, so that you can get a benefit of a longer sharper move.If there is no clarity, then check the 5 min for an intraday trade and see if you can identify a trend in that time frame since that time frame is most relevant to day traders.If there is no trend in 5 min take a rest.
Time frames less than 5 min require very fast decisions,there are lot of whipsaws which will trigger stops and the reward is less, so I would not advice anybody, and especially a novice, to even consider it.If you use a time frame less than 5 min because you can place smaller,tighter stops the whipsaw will defeat whatever benefit you get by triggering the stops so often that you will miss the move.
For positional or swing trading 20 min 60 min daily and weekly will work quite well.Entry and stops in 20 min can be tried.
|
|
| Back to top |
|
|
pradeepgolfer
White Belt
Joined: 16 Sep 2009
Posts: 212
|
| Post: #28 Posted: Wed Aug 18, 2010 8:08 am Post subject: |
|
|
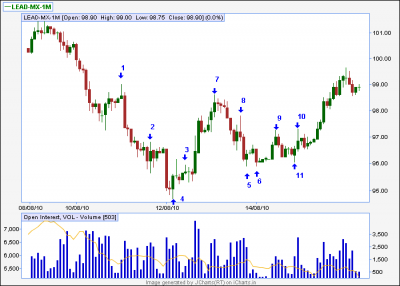
The two big green candles, which broke pivot 3, with the highest volume on the chart, showed the bulls were back.The expected resistance of pivot one, resulted in the fall to pivots 5 and 6. While the fall from pivot 7 was rejection of higher levels,pivots 5 and 6 were higher than pivot 4. This was also a test of the bulls confidence,strenght and willingness to support their position. After a rise to pivot 9, there was a trading range and pivot 11 was the third attempt to go down and the long down tail,was evidence of the rejection of even a small breakout on the downside.
This point was a good place to take a long position due to the considerations mentioned above.Also,the big swings and volatility had reduced, as evidenced by the small range of 3 bars.Small ranges with low volatility are ideal places to take positions due to the small stop loss that can be put,provided there are numerous other reasons to take the position.
An important point is to not give the downtrend, to the left of the chart any importance or you would be considering this a pull back in a bear fall.It is most important to treat recent market action as the most relevant evidence, since it is important to remain in the present.
Also, while it may be felt that a long might have been taken after the climactic red candle, wich resulted in low 4,there was only one reason to take the trade and that was the climactic action.Trades should have many reasons to be taken and at pivot 4, the only reason was the climactic action.
Taking the trade at pivot 11 had the following reasons:the two large green bull candles with high volume,a test of the pivot 4 and the bull green bars,a trading range for 3 bars above pivots 5 and 6 and a failed downside breakout maked by pivot 11.This made the trade a much surer one with a small stop and hence small risk.
| Description: |
|
| Filesize: |
12.77 KB |
| Viewed: |
551 Time(s) |
|
|
|
| Back to top |
|
|
pradeepgolfer
White Belt
Joined: 16 Sep 2009
Posts: 212
|
| Post: #29 Posted: Wed Aug 18, 2010 4:47 pm Post subject: |
|
|
spec
| Description: |
|
| Filesize: |
15.7 KB |
| Viewed: |
582 Time(s) |
|
|
|
| Back to top |
|
|
pradeepgolfer
White Belt
Joined: 16 Sep 2009
Posts: 212
|
| Post: #30 Posted: Fri Aug 20, 2010 10:01 am Post subject: TRADE MADE ON AUGUST 19 IN COPPER |
|
|
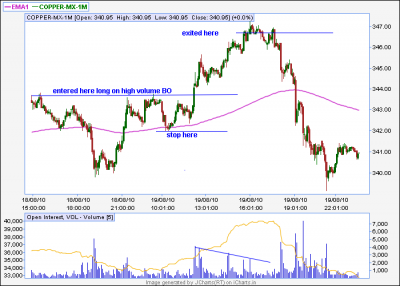
The trade was exited for the following reasons reasons:copper broke the previous high at 346.4,347.5 was a pivot high on the daily chart,volume was decreasing as copper was rallying.
| Description: |
|
| Filesize: |
16.12 KB |
| Viewed: |
579 Time(s) |
|
|
|
| Back to top |
|
|
|
|
You cannot post new topics in this forum
You cannot reply to topics in this forum
You cannot edit your posts in this forum
You cannot delete your posts in this forum
You cannot vote in polls in this forum
You can attach files in this forum
You can download files in this forum
|
Powered by phpBB © 2001, 2005 phpBB Group
|
|
|


