|
|
| View previous topic :: View next topic |
| Author |
What Is Technical Analysis |
pradeepgolfer
White Belt

Joined: 16 Sep 2009
Posts: 212
|
Post: #31  Posted: Fri Aug 20, 2010 5:13 pm Post subject: Posted: Fri Aug 20, 2010 5:13 pm Post subject: |
 |
|
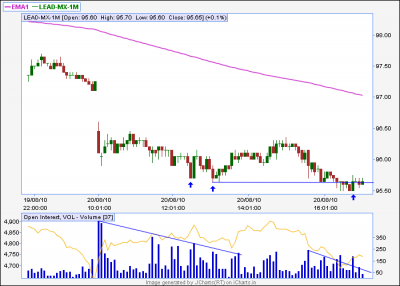
This is an example from commodities but since it illustrates a useful technical analysis concept or tool I am posting it in this thread also, so that stock and forex traders can also be aware of this simple but powerful trading technique.
On the chart lead is making new lows with ever decreasing volume showing there is no enthusiasm for selling at lower levels.This is reason enough to look to go long.
While it is good to have a favourite system getting confirmation from observing other things such as the many concepts/observations which I have continuously posting-explaining by charts-will make you enter, hold and manage the trade more confidently.Every trader knows confidence is the key since the market,your broker friends and SB all will try to tell you that you are wrong.
Always look for many reasons to take a trade.
| Description: |
|
| Filesize: |
17.95 KB |
| Viewed: |
562 Time(s) |
|
|
|
| Back to top |
|
 |
|
| |
pradeepgolfer
White Belt
Joined: 16 Sep 2009
Posts: 212
|
| Post: #32 Posted: Sun Aug 22, 2010 7:30 pm Post subject: |
|
|
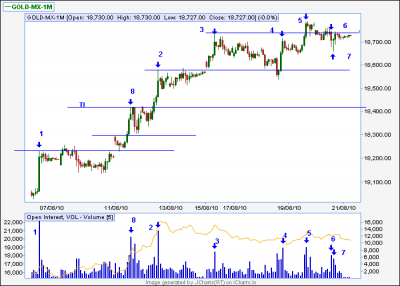
This is an example from commodities but since it illustrates a useful technical analysis concept or tool I am posting it in this thread also, so that stock and forex traders can also be aware of this simple but powerful trading technique.
Since this is sunday,my wife is going to visit her sick realtive and I am not drnking beer, I have time to explain these points, as a practical technical analysis lesson.
All the observations below will not take five minutes for me but it has taken me hours to explain, so I hope you all will read the below, as a lesson in technial analysis.
There are a lot of interesting points about the gold chart.
Bar 1 was a large bull bar, which closed almost at it's high.The corresponding volume marked 1, was also very large.Whenever there is very large volume, associated with a bar of any time frame, that bar will be tested:if the bar is a bull bar, the price will attempt to go below the bar's low-if it cannot go below the low, this shows the bulls are strong enough and willing to support their position; if the bar is a bear bar, then the price will attempt to break the high of that bear bar, to test whether the bears are strong enough and willing to protect their position.This is called a test
The test of bar one did not go anywhere near the low of the bar but took the shape of a tight range that lasted more tha 20 hours.That was an indication of the strength of the bulls or the unwillingness of the bears to be aggresive sellers:both, very bullish indications.
The opening gapped above the high of bar 1, confirming a successful test and the consequent pullback to the high of bar 1, was a breakout pullback and a buying opportunity. The breakout of that days high took gold to bar 8, which was a high volume bull bar, closing near the middle.The next bar could not take out the high of bar 8 and so the bears attacked and a big bear bar, that engulfed two bull bars, was the result.The next bear bar was a small body bear bar-almost a doji-showing that the bears could not maintain control and the green bar following the small bear bar, confirmed the bulls control and the breakout pullback.
The breakout above bar 8 took gold to bar 2 and the tight trading range at a major resistance level of 18550 and no rejection of that level,which was mentioned in the buy call given in my post dated 9 August ,showed gold may break that resistance.And break it did and with a gap and gold went up to bar 3-the volume, marked 3, was interestingly low, showing lack of partcipation, perhaps, and that resulted in a very long consolidation which ended when the gap was filled and the breakout of bar 2 was tested.The rally that resumed after the gap was filled,was accompanied by much better volume, showing participation was much better and that buyers were waiting at lower levels, while the bears were wiling to provide the supply.
Gold then went up to bar 4.The volume marked 4 was high and the range of bar 4 was much less, than the preceding bull bar, which had less volume.The smaller range but higher volume meant the bears were aggresively selling into bar 4.But the bears could not break the bar 4 low and gold went to bar 5.Bar 6 was a bear bar which broke the low of bar 5 and fell to bar 7 but the bulls came right back and took out the high of bar 6 by one rupee,thereby showing off their strength.
The breakout pullback from bar 3, went below the high of bar 2, by a small amount and the breakout pullback from bar 5, went below the high of bar 4, by a bigger amount,showing the bears were gaining,if only by a small amount.
From all these observations, a trading strategy has to be made, since we want to make money and not win a Nobel prize.
I have observed a lot of breakouts and breakout tests or pullbacks.But the breakout above bar 8 has not been tested and there is no breakout pull back.This is marked by the trendline marked TL; I expect the market will come down to this level to test it.
| Description: |
|
| Filesize: |
13.18 KB |
| Viewed: |
589 Time(s) |
|
|
|
| Back to top |
|
|
pradeepgolfer
White Belt
Joined: 16 Sep 2009
Posts: 212
|
| Post: #33 Posted: Mon Aug 23, 2010 8:34 am Post subject: |
|
|
I do not prefer indicators because they speak in relative terms-an overbought condition can become more overboughtThere can be lot of argument whether an indicator is overbought at 60 or 70 or 80 or 85.This is the same problem with moving averages-what period should be used? This is unnecessary complication.
Every single trader in the world will see a higher high and higher low and say it is a higher high and higher low.There can be no other interpretation.Every single trader will se a price pivot low and say that is a price pivot low.That is why I rely on these concepts in my strategy.Price is not relative, it is absolute.Rs 102 will mean Rs 102-no one can argue with that or say it actually means Rs 103.Volume will be clearly more or less or same.Price and volume is definite and fixed in the eyes of every single person.
I suggest you stick to such concepts where there can be no debate.Somebody will call a movement, a wave three while, somebody else will call it, wave C ! This is absurd but traders still use Elliot Wave.The aim in trading is to make money, not show to how smart you are.That is why traders are averse to letting their stops trigger because it shows they are not correct.
I prefer using price pivots to place stops.I prefer seeing price pivots to determine trend and stop loss.Pivots are market fixed and market determined.Using Fib ratios or calculated pivots for stop losses is again not fixed since there are many supports and resistances and many fib levels.Which one will be relevant to the market?
Using price pivots to determine trend will get you early into the trend.ADX for example will give different signals, if different time periods, are used.Which time period should be used? A trader may decide to use 30 periods but is it relevant to the market?
These are questions you have to answer and decide for yourself.
Finally, do you need 6 indicators to decide a girl is beautiful? Or do you simply look at her structure and decide? I look at market structure to decide, if a trade is beautiful, or not.
|
|
| Back to top |
|
|
SwingTrader
Site Admin
Joined: 11 Aug 2006
Posts: 2903
Location: Hyderabad, India
|
| Post: #34 Posted: Mon Aug 23, 2010 9:15 am Post subject: |
|
|
Pradeep,
Your whole thinking of technical analysis seems to be flawed. Your higher high/higher lows or anybody else's MACD/RSI/moving averages or Elliot waves or Fibonacci or Gann is not what works. What works is based on one's proper interpretation and application of it. Absolutely anything works in the markets if you know how to use it properly. When you say indicators do not work, it just shows that you do not know how to use those properly....they way you are talking about indicators clearly shows that. Actually, that is fine. In my technical analysis seminars I tell people that I am teaching what I know and it does not mean what I don't know/understand does not work in the markets. It just means I have not used it enough to realise if it works or not.
Just teach what you know and leave the rest to the users to decide. You are doing just fine, just leave out the criticism of indicators  you are insulting others who can use it effectively for trading...including I you are insulting others who can use it effectively for trading...including I 
Keep going.... 
_________________
Srikanth Kurdukar
@SwingTrader |
|
| Back to top |
|
|
sherbaaz
Yellow Belt

Joined: 27 May 2009
Posts: 543
|
| Post: #35 Posted: Mon Aug 23, 2010 10:33 am Post subject: |
|
|
| SwingTrader wrote: | Pradeep,
Your whole thinking of technical analysis seems to be flawed. Your higher high/higher lows or anybody else's MACD/RSI/moving averages or Elliot waves or Fibonacci or Gann is not what works. What works is based on one's proper interpretation and application of it. Absolutely anything works in the markets if you know how to use it properly. When you say indicators do not work, it just shows that you do not know how to use those properly....they way you are talking about indicators clearly shows that. Actually, that is fine. In my technical analysis seminars I tell people that I am teaching what I know and it does not mean what I don't know/understand does not work in the markets. It just means I have not used it enough to realise if it works or not.
Just teach what you know and leave the rest to the users to decide. You are doing just fine, just leave out the criticism of indicators you are insulting others who can use it effectively for trading...including I
Keep going.... |
Hi ST,
As always its a bull's eye again from you. Most of us suffer from David Copperfield syndrome i.e selective seeing.
Regards, 
|
|
| Back to top |
|
|
pradeepgolfer
White Belt
Joined: 16 Sep 2009
Posts: 212
|
| Post: #36 Posted: Mon Aug 23, 2010 12:42 pm Post subject: |
|
|
ST
Thanks for your thoughts and encouragement.
Pradeep
|
|
| Back to top |
|
|
shekharinvest
Yellow Belt
Joined: 21 Dec 2007
Posts: 549
|
| Post: #37 Posted: Mon Aug 23, 2010 4:52 pm Post subject: |
|
|
| pradeepgolfer wrote: |
Finally, do you need 6 indicators to decide a girl is beautiful? Or do you simply look at her structure and decide? I look at market structure to decide, if a trade is beautiful, or not. |
Beauty, like supreme dominion
Is but supported by opinion
pradeepgolfer, I must admit, I am mesmerized by your explanation of the price movement and still unable to comprehend them fully, but following you regularly. So keep posting with the charts, I am sure one day I will be able to see thru your eyes.
SHEKHAR
|
|
| Back to top |
|
|
pradeepgolfer
White Belt
Joined: 16 Sep 2009
Posts: 212
|
| Post: #38 Posted: Mon Aug 23, 2010 5:03 pm Post subject: |
|
|
Shekhar
Thanks. I hope I can continue, as it does take a lot of effort and far more time than anyone realises but it is persons like you, who even though not understanding fully, continue to keep an open mind, that will find a treasure.
I will post something in copper specially for you and I think it will be very simple to understand-so keep an eye here.
I had posted something on gold -in this thread- I hope you have read it; if not scroll down and read it.
There is a very simple concept explained there - I think you will find it easy to undersatnd and it is known as a "test".You will find it very interesting so do read it.
|
|
| Back to top |
|
|
shekharinvest
Yellow Belt
Joined: 21 Dec 2007
Posts: 549
|
| Post: #39 Posted: Tue Aug 24, 2010 7:09 am Post subject: |
|
|
| pradeepgolfer wrote: | Shekhar
Thanks. I hope I can continue, as it does take a lot of effort and far more time than anyone realises but it is persons like you, who even though not understanding fully, continue to keep an open mind, that will find a treasure.
I will post something in copper specially for you and I think it will be very simple to understand-so keep an eye here.
I had posted something on gold -in this thread- I hope you have read it; if not scroll down and read it.
There is a very simple concept explained there - I think you will find it easy to undersatnd and it is known as a "test".You will find it very interesting so do read it. |
Thanks pradeepgolfer for yor continued support, I have been following your all posts, still I would love your discourses on Nifty, simply because that's what I follow/trade. Copper / Gold for that matter any other commodity whatever you trade I read them to understand the market action from traders perspective, as you trade them.
Once I start shooting questions to you, you will know that it has started getting into my head as it should be. Hope, it would be not before eternity and you will keep posting until then.
Simplest of things takes longer to learn !
I fully recognise the efforts undertaken by you and know myself how much time and energy it takes to write a detailed post with charts etc. And rest assured that much time is also being devoted at this end to read your post keeping your charts alongside and trying to understand the concept and the thought process.
Having busied myself in other pursuits, I am myself, unable to contribute to the forum regularly.
SHEKHAR
|
|
| Back to top |
|
|
|
|
You cannot post new topics in this forum
You cannot reply to topics in this forum
You cannot edit your posts in this forum
You cannot delete your posts in this forum
You cannot vote in polls in this forum
You can attach files in this forum
You can download files in this forum
|
Powered by phpBB © 2001, 2005 phpBB Group
|
|
|


