|
|
| View previous topic :: View next topic |
| Author |
What Is Technical Analysis |
pradeepgolfer
White Belt

Joined: 16 Sep 2009
Posts: 212
|
Post: #1  Posted: Wed Aug 04, 2010 8:19 am Post subject: WHAT IS TECHNICAL ANALYSIS Posted: Wed Aug 04, 2010 8:19 am Post subject: WHAT IS TECHNICAL ANALYSIS |
 |
|
.
I have heard that patterns repeat itself, that history repeats itself,that what happened in a stock 20 years back, will influence a stock's movement, today.This is the fantastic theory on which all of Technical Analysis is said to be based.When I came across the first book on TA,15 years ago, I was fascinated.I read ELLIOT WAVE THEORY, Fibanacci, Demark indicators and for 15 years, I really discovered that history repeated itself.No, I did not find that stock markets and stocks and commodities repeated their action over time.
But I found that history repeated itself, as far as my financial balance was concerned-it kept depleting and depleting and depleting.I would add some margin money and history would repeat itself-that monetary balance would begin to vanish.
The assumption that market action repeats itself is one of the most dangerous assumptions that can ever be made.I have my bank records, for the last 15 years, to prove it.If you could access the bank records of 95% of traders, it would further emphasise it.
A trader's job is to trade or he will not get paid.But markets were not introduced or developed to be used for trading and have therefore no responsibilty or incentive to be tradable.This is the most frustrating conflict of interest in the entire history of Mankind.
If a market is not tradable, a trader will not make money.If a market is tradable, then it is doing something.The key to profits is to find out what the market is doing.
What is the market doing? What you use to ask the question is NOT important-I hear traders say that they use trendlines or MACD to trade.Some use Bollingerbands, Elliot Wave theory or Demark indicators.What answer you get by using a particular technique IS IMPORTANT.I will torture the stock or apply butter to the computer monitor,if that will get me the answer to THE QUESTION-what is the stock doing?.
|
|
| Back to top |
|
 |
|
| |
pradeepgolfer
White Belt
Joined: 16 Sep 2009
Posts: 212
|
| Post: #2 Posted: Thu Aug 05, 2010 7:03 am Post subject: SUPPORT AND RESISTANCES |
|
|
How to calculate support and resistances? There are many ways to calculate these using fibonacci numbers pivots and trendlines.If you use all of these you will get a lot of levels all of which may support the stock and you may incorporate it into your trading.
If you do decide to incorporate all these numbers into your trading strategy, even support from Reserve Bank of India, will only delay your eventual financial bankruptcy.
The only thing that matters is the trend-it will be strong at times may weaken and get strong again.As long as the market is making higher highs and higher lows or lower highs and lower lows nothing else matters.
Unless you are using a time frame of less than 5 minutes trends will not change in minutes.It will take at least hours to change a trend.Why? Because big players take a lot of time to accumulate and distribute.Because they NEED a lot of time there will be topping and bottoming signs which can be seen, in the form of higher lows or lower highs.One such botoming pattern was seen in copper on 4 August.
The explanation of this bottoming will be the subject of another post.PLEASE READ ALL THAT I POST.YOUR QUESTIONS ARE WELCOME BUT NOT TILL YOU READ ALL MY POSTS BECAUSE ALL MY POSTS ARE INTER CONNECTED.
|
|
| Back to top |
|
|
amitkbaid1008
Yellow Belt

Joined: 04 Mar 2009
Posts: 540
|
| Post: #3 Posted: Thu Aug 05, 2010 9:00 am Post subject: |
|
|
| Pradeep it will better if you post all your comments in single thread so that one can easily read all your posts.
|
|
| Back to top |
|
|
pradeepgolfer
White Belt
Joined: 16 Sep 2009
Posts: 212
|
| Post: #4 Posted: Thu Aug 05, 2010 9:11 am Post subject: |
|
|
| Good idea will do that
|
|
| Back to top |
|
|
pradeepgolfer
White Belt
Joined: 16 Sep 2009
Posts: 212
|
| Post: #5 Posted: Thu Aug 05, 2010 12:23 pm Post subject: example of a short term downtrend bottoming out |
|
|
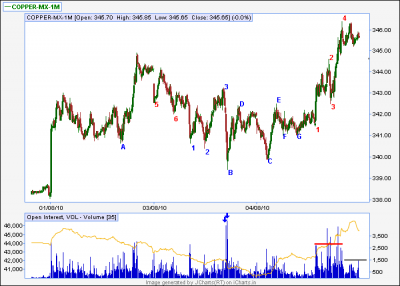
I will give you an example of a short term downtrend bottoming out.The chart is of copper 5 min but the same can be seen in a chart of any market and is valid for any time frame.
Any trend cannot turn around in a minute-it is a gradual process.
This process in copper took hours. The lows are indicated by numbers 1, 2 in red and by5,6,and B in blue.This showed that the trend was down.
However, the fall,which is marked 3B, in blue, was very steep and had a lot of bars with no overlap.This looked climactic.Further evidence of a selling climax was obtained if the volume at the bottom was noticed-that volume, marked by blue arrows, was very high and higher, than any volume, recorded on the chart. Copper having been in an uptrend for many days is another reason to expect those who missed the rally to ready buyers on all declines.
Now on the next day,4 Aug,copper opened gap down and in the first 5 min bar gapped below the 240 ma (not shown).This would have emboldened bears,seeing the downtrend the day before to go short with confidence.What looked to be a perfect trade was, in fact, a perfect bear trap.The hint of the trap was the selling climax the day earlier.The downtrend marked DC stopped at C and the uptrend to the high marked E, had a lot of bars, with no overlap indicating that the bulls were getting confident.Once copper crossed the high marked D there was,what looked like a rejection at the high marked E but that was negated very nicely by the double bottom marked F,G.
All this would have made, taking a long position, at around the area marked by number 1, almost a no risk trade.
There are some other interesting technical points to note.The area in volume, marked by the red line, shows very high volume for the uptrend and the area marked by the blue line, shows a big decrease of volume, as the consolidation takes place,just before the close.This shows bulls are confidently holding on to positions made during the day.
| Description: |
|
| Filesize: |
15.43 KB |
| Viewed: |
671 Time(s) |
|
|
|
| Back to top |
|
|
pradeepgolfer
White Belt
Joined: 16 Sep 2009
Posts: 212
|
| Post: #6 Posted: Thu Aug 05, 2010 12:49 pm Post subject: MY STRATEGY |
|
|
See first if the market is making are higher lows and higher highs or if it is making lower highs and lower lows. This can be seen with the eyes. Indicators are uneccessary-why eat with a spoon if you can use your hands? If there is a trend visible then go with the trend
Now repeat this process with a longer tf - I use 20 min and 60 min; if the trend is the same as in the 5 min tf, you will get a powerful move.
Trends may be clear but the sl is important - it should be within your risk profile. Any trend can change the next minute ! Where to put the sl? Put it below the higher low or above the lower high (if short). I personally put a deep stop.This will make it expensive for the operator to trigger your stop. However,if you are wrong about the trend however deep a stop you put,will be eventually triggerred
I will post some examples of some actual trades.In the meantime keep seeing as many charts you can and observe the market without any distraction like indicators or moving averages.
If you do not know how to read candlestick charts learn the basics of that method.
make a note of swings and the lenght variation and the slope of graph.Meaning how steeply the market moves up.I will describe all this in some charts as time goes on.
In the meantime trade very small positions and try to observe the market.
Keep following my posts.I will try to post some educative material like videos which will help you gain some valuable insights into market action.
You do not need indicators. I use a 240 period moving average in 5 min and 60 min.240 period ma in 5 min is the same as the 20 period ma in 60 min. This helps confirm the longer term trend.But if PT would tomorrow remove moving averages I would not be disadvantaged in any way.
To trade you need to know direction-that can be identified by the naked eye.Higher highs and higher lows define an up trend.
But since markets are fractal in nature meaning there may be different trends in different time frames it is not easy to know which position to take. Generally I see first the daily;then the 60 min then the 20 min and for entry use 5 min.
Since you want to be in the position till the trend exists you want to be stopped out once the trend is in doubt.So the stop should be below the higher low.
Sometimes there are major higher lows and major higher highs with a few minor ones in between.For a novice it may be confusing which ones to take-that will take a little practice.
However if you are not able to immediately see the trend do not try hard to find it out-do not trade when in doubt.
Indicators were useful before the advent of live charts and worked well in trading ranges on the daily.But, with intraday charts, there will always be a trend, in some small tf,even in a trading range.So if you want to trade a trading range, you can go down to the 5 min or 3 min or even 1 min tf. You will find always a trend if you go down to a low enough tf.
But you should put the stop according to the structure in the 5 min.
But you have to book your profits much faster in a 3 min or 1 min tf.
Indicators are therefore no longer necessary nowadays.
It is as simple as you want it to be.
Sometimes there is no doubt where the higher high and higher low is. Other times there wll be a major low and then a minor higher high and minor higher low. If the market structure looks complicated and you cannot find clarity, look for simplicity somewhere else or wait for clarity or do not trade.
It is very simple because on some TF you will find a trend;the market will dictate a stop.You have to decide whether that is acceptable to you or not.If it is not wait and see if the market is kind enough to move closer to the stop and lessen your risk.I normally take whatever the market gives me in terms of rate but that is a decision you have to make.
You cannot decide the target. That the market will do. You are the passenger,not the driver.If the train you are in is going to Delhi but it turns around and starts to go towards Bangaleru.Now everybody will insist the train is going to Delhi.You can see it is going to Bangaleru.There is only one thing to do:GET OUT.
As any experienced trader will tell you, deciding when to take your profits is one of the most difficult decisions to make.
Your stop is dictated by the past.Target will be decided by future market action.You must learn to recognise some single bar signals which may indicate a turning point.The problem with single bar signals is that the operator can manufacture one and trap you.
However because the operator will want to trap as many people as he can,
the change of trend will take place very gradually and if you are observant
you can get enough warning.I hope to explain with some chart examples a little later.
|
|
| Back to top |
|
|
pradeepgolfer
White Belt
Joined: 16 Sep 2009
Posts: 212
|
|
| Back to top |
|
|
pradeepgolfer
White Belt
Joined: 16 Sep 2009
Posts: 212
|
| Post: #8 Posted: Thu Aug 05, 2010 2:54 pm Post subject: examples of my trading strategy |
|
|
A decision to make a trade cannot be made because of only one reason or two.This because for a trade to be successful you have to right twice-when you enter and when you exit.Also you are fighting a number of strong enemies-big players,operators who have considerable power and Time itself.
First the background to the trade.For eight days in a row copper has not broken the previous day's low.Do NOT yield to the temptation to believe that it has gone up for eight days in a row and therefore a down day or two, is inevitable.I remember, in 2006, ACC went up for 30 trading sessions in a row without once breaking the previous days low.This observation decides two things for the trader.One the trend is up and strongly up and only long trades are to be taken.Two it decides the stop loss.Which should be below the previous day's low.
These two are the most crucial foundation for a trade-the trend and the stop.If these two are not clear do not trade.Too many traders spend hours analysing a stock or market using all kinds of methods such as elliot wave Demark indicators fibanacci numbers.If you cannot SEE the trend and stop in a few minutes do not trade.
If market is complicated do not trade.Complicated markets make losing money simple.If somebody is troublesome avoid him.Trade on your terms not the operator's.
See it and trade it. Cannot see it,see a movie instead.Or post something useful for others
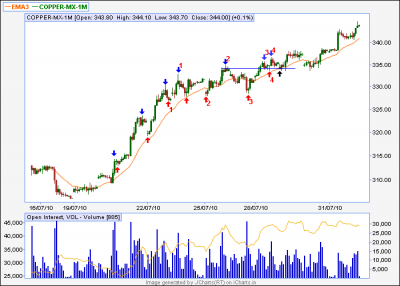
Since the trend on the daily is up check the intraday charts for an entry.
The chart below is of the 60 min copper with a 20 ma.The red arrows mark higher lows, the blue arrows mark higher highs and the black arrow is the buying point. Red numbers mark the swings- 11, 22, 33 44.ALL the swings formed higher highs and higher lows.Also notice that the lenght or size of the downmove after swings 11 and 22 tested the low point of the swing.Now notice the lenght of the downmove after swing 33.The consolidation after swing 33 was very tight and not downward but horizontalThis indicated selling pressure has now disappeared.A tight consolidation took place for nine hours above the swing high of swing 2.
All these were the reasons for taking the trade.Reasons should be based on market structure and not on any trader's intuition.
While an attempt can be made to fine tune the entry further, do not attempt to aim for perfection.I am quite happy to accept what the market is kind enough to give me.I am free to refuse that and wait for a better offer.And most times I do that.
You may be wondering how to spot higher highs and higher lows.Do not search for exact definitions:markets are not perfect and they often are highly emotional which makes for very confusing structure.Operators take advantage of illiquid periods to influence or manufacture wild volatility which will confuse indicators, trigger stops and break high or lows by minor amounts.Experience will show you when to recognise these false but dramatic moves.However remember that to maufacture such gyrations the operator has to incur a cost.Which is why such moves will break important levels by minor amounts only,in order to to trap trigger happy or emotional or nervous traders.The important thing is to observe if you can a recognise a broad uni-directional movement.That is the first thing to do.If there is such a structure look more closely and see if you can find some hh and hl s. These also need not be perfect-it can be violated by 3-4 ticks.Some stocks are more well behaved than others.Natural gas is not behaved at all and it requires huge stops.If you can see a trend then locate the stop.I say locate the stop, not decide the stop because the stop has to be below a point to be decided by market structure and not by what amount you want to lose or risk. If the risk is too high or clarity is not there do not trade
I do not use the MA like everyone else does-I use it only after a trend is recognised.I do not use it to identify the trend.Many traders will think a break of the 20MA MEANS A TREND HAS ENDED: it does not mean that-I use it as a useful reference point.If it breaks the 20 period ma on the downside that is not a signal to sell.But every time it breaks 20 ma you should buy-THe trend has ended only after a LH AND A LL when you can use the 20 ma to identify shorting opportunities.
If you have any doubts or questions please feel free to contact me.
| Description: |
|
| Filesize: |
16.47 KB |
| Viewed: |
668 Time(s) |
|
|
|
| Back to top |
|
|
pradeepgolfer
White Belt
Joined: 16 Sep 2009
Posts: 212
|
| Post: #9 Posted: Thu Aug 05, 2010 4:19 pm Post subject: USING 240 MA FOR TRADING |
|
|
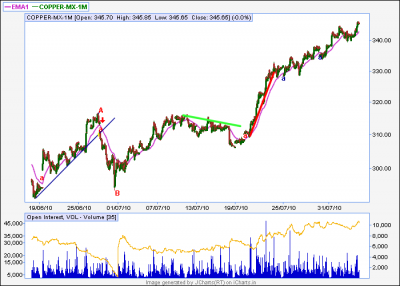
Using a 240 period ma with a 5 min chart often shows up very good trading opportunities, when the market gaps the ma.The chart I am using is copper 5 min but you can use any market in the 5 min time frame.The gaps are marked with red 'a' and there are 3 such red 'a'.One is below the red arrow the other two are visible clearly.
When such a gap takes place trade in the direction of the gap-go long if it opens up and short if it opens down.There is a red trend line drawn on the chart;below that red line there is a gap marked 'a'.Notice it gapped above the 240 ma and it resulted in a very steep rally.After such a rapid rise any breaks of the 240 ma, should be bought.This is a important point.Such places which are buying opportunities are marked by blue 'a'.
Notice the rally marked by the blue trend line.This was followed by a steep fall marked by the capitals AB IN RED. THe next fall marked by the green trendline was a very shallow fall which fell very little in lot of time, showing the bears were not selling aggressively and so the sharp rally that came AFTER THIS FALL, was no surprise.
| Description: |
|
| Filesize: |
19.08 KB |
| Viewed: |
681 Time(s) |
|
|
|
| Back to top |
|
|
kraj67
White Belt
Joined: 17 Jun 2009
Posts: 13
|
| Post: #10 Posted: Thu Aug 05, 2010 4:19 pm Post subject: nifty |
|
|
| can u pls post ur study based on nifty as we dont trade commodities
|
|
| Back to top |
|
|
pradeepgolfer
White Belt
Joined: 16 Sep 2009
Posts: 212
|
| Post: #11 Posted: Fri Aug 06, 2010 4:17 am Post subject: |
|
|
Kraj
This is a thread on Technical analysis. The principles and techniques explained here can be used on any anything-any market.
I have not subscribed to equities and so do not get intraday charts of NF and so I cannot explain using NF.
|
|
| Back to top |
|
|
shekharinvest
Yellow Belt
Joined: 21 Dec 2007
Posts: 549
|
| Post: #12 Posted: Fri Aug 06, 2010 10:03 am Post subject: |
|
|
Pradeepgolfer,
What a prolific writer you are ! I must compliment you for your efforts.
The gap theory on 5min Tf with 240 ema does not cut the ice. You yourself have highlighted the inherent contradiction with red 'a' and blue 'a' and the reason offered for opposite action in both the cases is not convincing enough. Infact they seems to utilize the benefit of hindsight.
Somewhere, you have written that you are not posting charts etc. because of some fellow members, I request you to post them with your analysis, your analysis provides and opportunity to understand the market action.
SHEKHAR
|
|
| Back to top |
|
|
pradeepgolfer
White Belt
Joined: 16 Sep 2009
Posts: 212
|
| Post: #13 Posted: Fri Aug 06, 2010 10:16 am Post subject: |
|
|
shekharinvest
If anyone is interested to see them then I can make the effort to analyse that particular commodity of interest in total detail.I do not get intraday or EOD charts of NF, if not I would have posted charts of that too.
I have advanced get software for EOD but have no idea how to transfer those charts into the forum.
I will continue to continue to post charts which illustrate technical analysis priinciples or my strategy or actual trades.
Thank you for your encouragement
This is only one technique I use and it cannot be taken in isolation.There should be numerous reasons for taking a trade.
If you use a technique you should believe in it; otherwise you will not be confident.If you feel it doe not cut the ice and it is the benefit of hindight you can do two things.1.ignore it totally 2. see if it works in live conditions.
A strong trend once it has been in force for some time is obvious to see with the naked eye, so the method is different.This the case with indicators also-in a strong trend you have to ignore divergences- you have to read them differently
This is not a basic technical analysis principle so you can ignore it.
|
|
| Back to top |
|
|
shekharinvest
Yellow Belt
Joined: 21 Dec 2007
Posts: 549
|
| Post: #14 Posted: Fri Aug 06, 2010 2:24 pm Post subject: |
|
|
| pradeepgolfer wrote: |
This is only one technique I use and it cannot be taken in isolation.There should be numerous reasons for taking a trade.
If you use a technique you should believe in it; otherwise you will not be confident.If you feel it doe not cut the ice and it is the benefit of hindight you can do two things.1.ignore it totally 2. see if it works in live conditions.
|
I agree with you it can not be used in isolation, if it is part of your overall strategy. I thought it to be an independent strategy.
I am trying to understand the strategy in toto.
I will highly appreciate if you will post the charts. When the trade is taken. You can post the commodity charts (Copper OR any other your trade).
To believe in strategy one has to be clear of all doubts. Clarity comes from questioning the established wisdom.
SHEKHAR
|
|
| Back to top |
|
|
pradeepgolfer
White Belt
Joined: 16 Sep 2009
Posts: 212
|
| Post: #15 Posted: Fri Aug 06, 2010 10:25 pm Post subject: |
|
|
Shekhar
Yes ! I agree with that totally ! "Clarity comes from questioning the established wisdom".
Yes you have to be confident and trust the strategy.
I will post various things and what I learned in 15 years cannot be described in a day or 2.
Practice seeing as many charts as possible so that you will know what is possible.
A little patience will be needed but any specific questions you have, may be put to me and i will do my best to clear them. The answers would benefit others so do not hesitate to ask.Even if you have some doubts about indicators you can ask me since I have used them too earlier.
Trusting a strategy takes time and a lot of work.
All the best
|
|
| Back to top |
|
|
|
|
You cannot post new topics in this forum
You cannot reply to topics in this forum
You cannot edit your posts in this forum
You cannot delete your posts in this forum
You cannot vote in polls in this forum
You can attach files in this forum
You can download files in this forum
|
Powered by phpBB © 2001, 2005 phpBB Group
|
|
|


