| View previous topic :: View next topic |
| Author |
Why Most Traders Lose Money and Why the Market Requires It |
mikky
Green Belt

Joined: 16 Feb 2014
Posts: 1442
|
Post: #16  Posted: Mon Sep 01, 2014 8:31 pm Post subject: Posted: Mon Sep 01, 2014 8:31 pm Post subject: |
 |
|
Trend Trading Setup
Price Patterns:
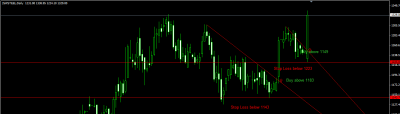
After a pullback, in order for the uptrend to continue the price must begin to move higher again. Trend lines can often be drawn around the correction, identifying its course; when the price breaks above the trend line it signals the correction is likely over, and the trend is resuming.
There are always multiple pullbacks, of varying degrees of intensity, during a trend. Active traders may wish to participate in many of them, while longer-term traders may only wish to participate on longer-term opportunities.
The main problem with this strategy is that the trendline may need to be drawn multiple times before a breakout occurs. In hindsight it is easy to draw a line connecting the high points of the pullback, but in real-time is can be a challenge and takes practice. The upside is that the reward significantly outweighs risk if the trend continues. Therefore, even if a couple losing trades occur before a winner, the strategy can still be profitable.
Shown is the example of JSW Steel on daily chart. Same can be done on lower time frames like 1 min., 5 min., 15 min., 30 min. etc.
| Description: |
|
| Filesize: |
23.72 KB |
| Viewed: |
487 Time(s) |
|
|
|
| Back to top |
|
 |
|
| |
|
|
You cannot post new topics in this forum
You cannot reply to topics in this forum
You cannot edit your posts in this forum
You cannot delete your posts in this forum
You cannot vote in polls in this forum
You can attach files in this forum
You can download files in this forum
|
Powered by phpBB © 2001, 2005 phpBB Group
|
|


