| View previous topic :: View next topic |
| Author |
Wrong Low of Candle in Nifty 5 Mins |
ronypan
White Belt

Joined: 07 Aug 2010
Posts: 197
|
Post: #1  Posted: Wed Nov 02, 2011 9:42 am Post subject: Wrong Low of Candle in Nifty 5 Mins Posted: Wed Nov 02, 2011 9:42 am Post subject: Wrong Low of Candle in Nifty 5 Mins |
 |
|
Dear Admin,
Kindly check... In Nifty 5 Mins Charts First Candle is showing low of 5252.25 and actual low is 5243... Why is it so? I face this problem many times...
Plz do check..
Regards,
Rony
|
|
| Back to top |
|
 |
|
| |
SwingTrader
Site Admin
Joined: 11 Aug 2006
Posts: 2903
Location: Hyderabad, India
|
|
| Back to top |
|
|
ronypan
White Belt
Joined: 07 Aug 2010
Posts: 197
|
| Post: #3 Posted: Wed Nov 02, 2011 12:47 pm Post subject: Re: Wrong Low of Candle in Nifty 5 Mins |
|
|
OK..
|
|
| Back to top |
|
|
nkiran
White Belt
Joined: 02 Apr 2010
Posts: 38
|
| Post: #4 Posted: Sun Feb 26, 2012 7:47 am Post subject: Last 1 second candle |
|
|
Hi,
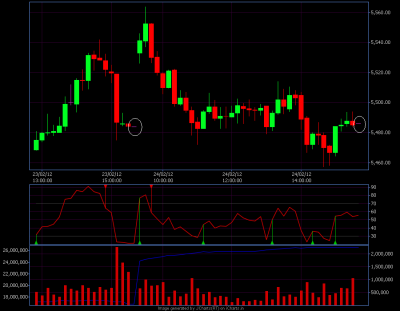
I am not able to understand why I am getting 1 second candle as shown in the chart. (last candle of the day) (shown in circle)
The chart is of 10 min timeframe.
Admin please help how to remove these candles. This last candle may be affecting the EMA/other technical indicators.
Sorry I am not able to find the perfect thread for this query so posting here.
regards,
nkiran
| Description: |
|
| Filesize: |
42.92 KB |
| Viewed: |
542 Time(s) |
|
|
|
| Back to top |
|
|
pkholla
Black Belt

Joined: 04 Nov 2010
Posts: 2890
|
| Post: #5 Posted: Sun Feb 26, 2012 9:09 am Post subject: |
|
|
| nkiran: if u see closely the first 5 min candle for example runs from 091500 to 091959 etc. So the last 5 min candle runs 152500 to 152959. So you have a 1 sec candle for 153000-153000 ok? rgds prakash holla
|
|
| Back to top |
|
|
vinay28
Black Belt
Joined: 24 Dec 2010
Posts: 11748
|
| Post: #6 Posted: Sun Feb 26, 2012 11:06 am Post subject: |
|
|
| This happens almost everyday
|
|
| Back to top |
|
|
kamal.icharts
Site Admin
Joined: 10 Apr 2013
Posts: 576
|
| Post: #7 Posted: Sun Feb 26, 2012 6:11 pm Post subject: Re: Last 1 second candle |
|
|
Dear nkiran,
We will look into the issue and try to find an optimum solution to avoid it.
Regards
Kamal
| nkiran wrote: | Hi,
I am not able to understand why I am getting 1 second candle as shown in the chart. (last candle of the day) (shown in circle)
The chart is of 10 min timeframe.
Admin please help how to remove these candles. This last candle may be affecting the EMA/other technical indicators.
Sorry I am not able to find the perfect thread for this query so posting here.
regards,
nkiran |
|
|
| Back to top |
|
|
|
|
You cannot post new topics in this forum
You cannot reply to topics in this forum
You cannot edit your posts in this forum
You cannot delete your posts in this forum
You cannot vote in polls in this forum
You can attach files in this forum
You can download files in this forum
|
Powered by phpBB © 2001, 2005 phpBB Group
|
|


