| View previous topic :: View next topic |
| Author |
WW ON EOD CHARTS |
rk_a2003
Black Belt

Joined: 21 Jan 2010
Posts: 2734
|
Post: #271  Posted: Fri Mar 15, 2013 10:18 am Post subject: Posted: Fri Mar 15, 2013 10:18 am Post subject: |
 |
|
| rk_a2003 wrote: | | rk_a2003 wrote: | | Infy is consolidating around 2860 range without responding to the fall of Index. What for this consolidation.Is it for an upmove.Let us see.SL for short trdes can be around 2905 spot. |
This 2860 region is lying on UTL (Look at the chart) . So, it means INFY is taking support here at least as of now, and there is a bright chance of going up from here in case it gets a little support from index.
The next support for INFY is coming around 2800-2750 zone which is going to be really strong support. If this level is breached then a steep fall and correction can be expected, otherwise your TSL should come for your rescue. |
Well, TSL came for our rescue. 
|
|
| Back to top |
|
 |
|
|
 |
vinay28
Black Belt

Joined: 24 Dec 2010
Posts: 11748
|
Post: #272  Posted: Fri Mar 15, 2013 10:22 am Post subject: Posted: Fri Mar 15, 2013 10:22 am Post subject: |
 |
|
After covering my shorts day before, I had gone long in infy. booked that too. 
|
|
| Back to top |
|
 |
rk_a2003
Black Belt

Joined: 21 Jan 2010
Posts: 2734
|
Post: #273  Posted: Fri Mar 15, 2013 10:49 am Post subject: Posted: Fri Mar 15, 2013 10:49 am Post subject: |
 |
|
| vinay28 wrote: | After covering my shorts day before, I had gone long in infy. booked that too.  |
You are an awesome timer Vinay. Are you short now? I am still thinking at what levels I should short again; near 3000 levels it appears to be a perfect short with low risk high reward.
|
|
| Back to top |
|
 |
vinay28
Black Belt

Joined: 24 Dec 2010
Posts: 11748
|
Post: #274  Posted: Fri Mar 15, 2013 10:57 am Post subject: Posted: Fri Mar 15, 2013 10:57 am Post subject: |
 |
|
no RK, in spite of today's high of 2924fut, vol in 3000pe hasn't picked up, just 500. May be selling will begin around 2950 spot. But I will be watching vol of 3000pe today onwards. If it picks up to say a few thousands, I may start nibbling. Problem is march expiry is closing.
I had bought pe at 79 and sold at 135 recently before going long
|
|
| Back to top |
|
 |
vinay28
Black Belt

Joined: 24 Dec 2010
Posts: 11748
|
Post: #275  Posted: Fri Mar 15, 2013 2:48 pm Post subject: Posted: Fri Mar 15, 2013 2:48 pm Post subject: |
 |
|
| RK, buying in 2900pe has begun but I will wait till monday or earliest near eod today
|
|
| Back to top |
|
 |
rk_a2003
Black Belt

Joined: 21 Jan 2010
Posts: 2734
|
Post: #276  Posted: Fri Mar 15, 2013 2:53 pm Post subject: Posted: Fri Mar 15, 2013 2:53 pm Post subject: |
 |
|
| vinay28 wrote: | | RK, buying in 2900pe has begun but I will wait till monday or earliest near eod today |
OK, Thanks.
|
|
| Back to top |
|
 |
vinay28
Black Belt

Joined: 24 Dec 2010
Posts: 11748
|
Post: #277  Posted: Fri Mar 15, 2013 3:13 pm Post subject: Posted: Fri Mar 15, 2013 3:13 pm Post subject: |
 |
|
| see if you can buy a lot (PE) at ATP to start with
|
|
| Back to top |
|
 |
vinst
Black Belt

Joined: 09 Jan 2007
Posts: 3303
|
Post: #278  Posted: Sat Mar 16, 2013 8:54 am Post subject: Posted: Sat Mar 16, 2013 8:54 am Post subject: |
 |
|
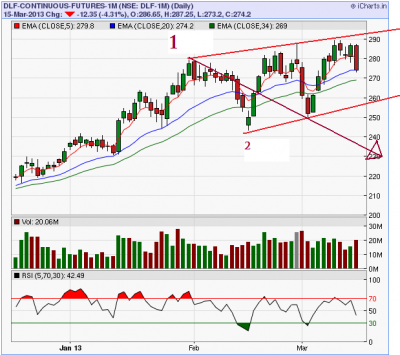
DLF bearish WW on EOD charts (futures)
| Description: |
|
| Filesize: |
35.97 KB |
| Viewed: |
309 Time(s) |
|
|
|
| Back to top |
|
 |
rk_a2003
Black Belt

Joined: 21 Jan 2010
Posts: 2734
|
Post: #279  Posted: Sat Mar 16, 2013 2:56 pm Post subject: Posted: Sat Mar 16, 2013 2:56 pm Post subject: |
 |
|
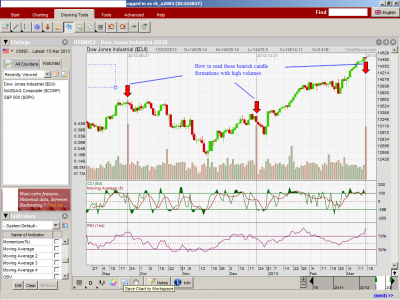
| rk_a2003 wrote: | Look at the comparative charts of DOW and NIFTY. We cannot say that there is no correlation between them it may not be directly proportional but some sort of co relation does exist.
Well,Dow made a –ww pattern with overshoot. How long this overshoot can extend; we don’t know. Once a bearish candle is formed we may assume that the down trend started, still there is no guarantee for its continuation. We may keep on hoping it to go down till the overshoot extends beyond permissible level…
One thing is sure once US markets went for correction Indian markets cannot go up. They too should correct. In fact Indian markets are looking tired when Dow is registering new highs day by day. For Dow to go for a correction it may take a big bang news, otherwise it’s not that easy for it to come down. |
Well,Finally dow registered a bearish candle(a weak one) will it go further down?.What the arrows are indicating?How to interpret them?
| Description: |
|
| Filesize: |
125.28 KB |
| Viewed: |
337 Time(s) |
|
Last edited by rk_a2003 on Sat Mar 16, 2013 3:01 pm; edited 1 time in total |
|
| Back to top |
|
 |
rk_a2003
Black Belt

Joined: 21 Jan 2010
Posts: 2734
|
Post: #280  Posted: Sat Mar 16, 2013 2:59 pm Post subject: Posted: Sat Mar 16, 2013 2:59 pm Post subject: |
 |
|
| -Deleted-
|
|
| Back to top |
|
 |
chandrujimrc
Brown Belt

Joined: 21 Apr 2009
Posts: 1683
|
Post: #281  Posted: Sat Mar 16, 2013 9:50 pm Post subject: Posted: Sat Mar 16, 2013 9:50 pm Post subject: |
 |
|
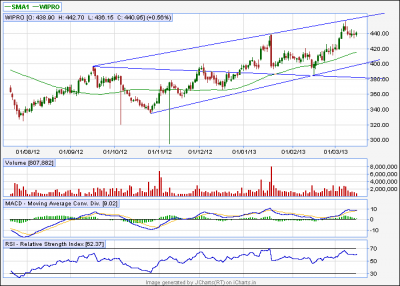
Wipro EOD -WW.
| Description: |
|
| Filesize: |
14.47 KB |
| Viewed: |
324 Time(s) |
|
|
|
| Back to top |
|
 |
rk_a2003
Black Belt

Joined: 21 Jan 2010
Posts: 2734
|
Post: #282  Posted: Mon Mar 18, 2013 9:30 am Post subject: Posted: Mon Mar 18, 2013 9:30 am Post subject: |
 |
|
| rk_a2003 wrote: | | rk_a2003 wrote: | Look at the comparative charts of DOW and NIFTY. We cannot say that there is no correlation between them it may not be directly proportional but some sort of co relation does exist.
Well,Dow made a –ww pattern with overshoot. How long this overshoot can extend; we don’t know. Once a bearish candle is formed we may assume that the down trend started, still there is no guarantee for its continuation. We may keep on hoping it to go down till the overshoot extends beyond permissible level…
One thing is sure once US markets went for correction Indian markets cannot go up. They too should correct. In fact Indian markets are looking tired when Dow is registering new highs day by day. For Dow to go for a correction it may take a big bang news, otherwise it’s not that easy for it to come down. |
Well,Finally dow registered a bearish candle(a weak one) will it go further down?.What the arrows are indicating?How to interpret them? |
DOW registered a bearish candle and week end news of Cyprus crisis.Is this leading for a correction in international markets?.We may hope, though there is no guarantee.
US futures are still not displaying any remarkable weakness.But, we can say risk reward is good for short traders.
|
|
| Back to top |
|
 |
sureenderkalra
White Belt

Joined: 11 Dec 2012
Posts: 174
|
Post: #283  Posted: Mon Mar 18, 2013 9:57 am Post subject: +WW IN RENUKA (EOD CHART) Posted: Mon Mar 18, 2013 9:57 am Post subject: +WW IN RENUKA (EOD CHART) |
 |
|
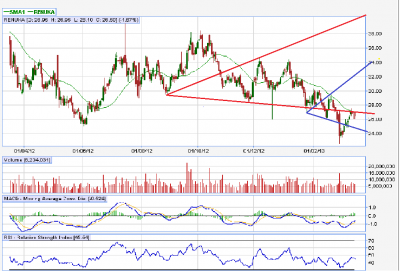
+ WW IN RENUKA ON EOD BASIS.
| Description: |
|
| Filesize: |
47.44 KB |
| Viewed: |
281 Time(s) |
|
|
|
| Back to top |
|
 |
deepakms
White Belt

Joined: 13 Aug 2009
Posts: 194
|
Post: #284  Posted: Tue Mar 19, 2013 8:11 pm Post subject: Posted: Tue Mar 19, 2013 8:11 pm Post subject: |
 |
|
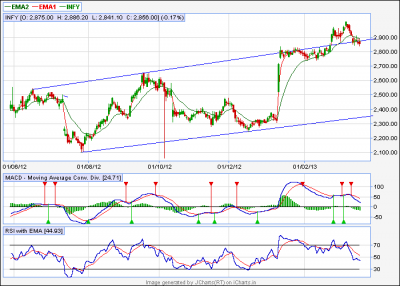
This 2860 region is lying on UTL (Look at the chart) . So, it means INFY is taking support here at least as of now, and there is a bright chance of going up from here in case it gets a little support from index.
The next support for INFY is coming around 2800-2750 zone which is going to be really strong support. If this level is breached then a steep fall and correction can be expected, otherwise your TSL should come for your rescue.[/quote]
Hi Rk,
INFY has broken and closed below the trendline......2860 today.
Rgds
| Description: |
|
| Filesize: |
16.76 KB |
| Viewed: |
281 Time(s) |
|
|
|
| Back to top |
|
 |
apka
Black Belt

Joined: 13 Dec 2011
Posts: 6137
|
Post: #285  Posted: Tue Mar 19, 2013 8:47 pm Post subject: Posted: Tue Mar 19, 2013 8:47 pm Post subject: |
 |
|
@ deepakms
if its closing below the upper trendline, doesnt it activate the -ww?
|
|
| Back to top |
|
 |
|

