| View previous topic :: View next topic |
| Author |
WW ON EOD CHARTS |
chetan83
Brown Belt

Joined: 19 Feb 2010
Posts: 2036
|
Post: #406  Posted: Wed Apr 10, 2013 10:52 pm Post subject: Posted: Wed Apr 10, 2013 10:52 pm Post subject: |
 |
|
| chandrujimrc wrote: | | IS it valid? Infy EOD +WW. |
Chandru, try taking point 1 from the Gap...I have posted the view on one thread, Market Direction, INFY Quarterly results...
|
|
| Back to top |
|
 |
|
|
 |
chandrujimrc
Brown Belt

Joined: 21 Apr 2009
Posts: 1683
|
Post: #407  Posted: Fri Apr 12, 2013 7:51 pm Post subject: Posted: Fri Apr 12, 2013 7:51 pm Post subject: |
 |
|
Infy EOD -ww formed after last qtr result ,first tgt reached today.
| Description: |
|
| Filesize: |
30.1 KB |
| Viewed: |
312 Time(s) |

|
|
|
| Back to top |
|
 |
chandrujimrc
Brown Belt

Joined: 21 Apr 2009
Posts: 1683
|
Post: #408  Posted: Fri Apr 12, 2013 8:25 pm Post subject: Posted: Fri Apr 12, 2013 8:25 pm Post subject: |
 |
|
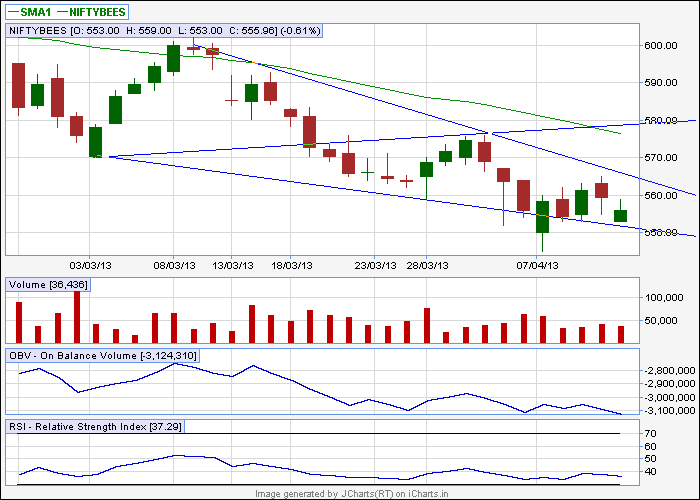
Nifty Bees EOD +WW still within the channel only,So still there is a chance for Nifty reaching 5800.
| Description: |
|
| Filesize: |
11.16 KB |
| Viewed: |
671 Time(s) |
|
|
|
| Back to top |
|
 |
vinay28
Black Belt

Joined: 24 Dec 2010
Posts: 11748
|
Post: #409  Posted: Sat Apr 13, 2013 12:12 pm Post subject: Posted: Sat Apr 13, 2013 12:12 pm Post subject: |
 |
|
| vinay28 wrote: | | no chandru. you have take top of green inverted hammer as 4 and target is about 3000. If you take 4 as top of red candle, target is 2920. Also, daily candle is an inside bar. |
chandru, high on 11th was 2935. I was long from 8th and made good profit. 
|
|
| Back to top |
|
 |
vinay28
Black Belt

Joined: 24 Dec 2010
Posts: 11748
|
Post: #410  Posted: Sat Apr 13, 2013 12:19 pm Post subject: Posted: Sat Apr 13, 2013 12:19 pm Post subject: |
 |
|
| chetan83 wrote: | Hi,
If Vinay can let lose his Black Magic (with the grace of Black Belt) and if Bank Nifty starts its upmove....
Then from today on onwards I would like to BET on IOB......because of +WW and also IF (and only IF) there is a Green candle close with good volume then NVK set-up will be valid for at least 70.30 and 76++,
CMP - 63.80, SL - 63 (EOD CLOSE) |
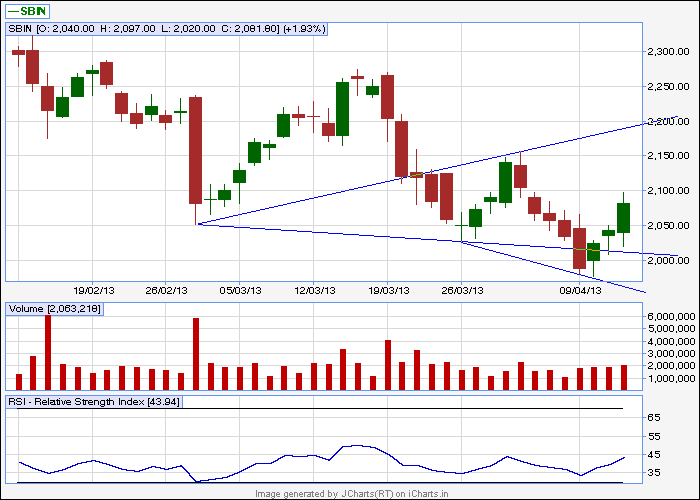
oops, chetan. I saw this only now. Sorry. But no sign of a green candle with good volume yet. SBIN has an acceptable volume with green candle I feel and chart is attached. Mild +ve div on rsi also.
| Description: |
|
| Filesize: |
10.18 KB |
| Viewed: |
695 Time(s) |
|
|
|
| Back to top |
|
 |
saumya12
Brown Belt

Joined: 21 Dec 2011
Posts: 1509
|
Post: #411  Posted: Sat Apr 13, 2013 12:26 pm Post subject: Posted: Sat Apr 13, 2013 12:26 pm Post subject: |
 |
|
| chandrujimrc wrote: | | Nifty Bees EOD +WW still within the channel only,So still there is a chance for Nifty reaching 5800. |
Thanks Chandruji
You means to say that if it moves below the channel line, then this +ww will get invalid/cancelled. 
I shall be thankful if you please post the practical rules that govern the formation of WWs, I mean those that are not mentioned in literature, but have application in validity.
Further, I want to know, is there any such rule that point 4 should lie between points 1 and 2 and cant be below/just below point 1 in +ww (that is, the line joining 1 and 4 should be upward and should not be downward or horizontal)(as this can happen in case the price has moved upward and then downwards steeply and then some upwards but below or equal to point 1 and moved downwards to form point 5)
Thanks
|
|
| Back to top |
|
 |
vinay28
Black Belt

Joined: 24 Dec 2010
Posts: 11748
|
Post: #412  Posted: Sat Apr 13, 2013 12:28 pm Post subject: Posted: Sat Apr 13, 2013 12:28 pm Post subject: |
 |
|
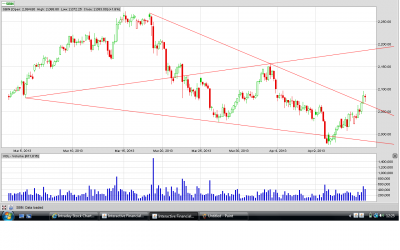
Just for comparison with daily chart posted a few min ago, here's a likely +ww in sbin on 60tf with almost same target. Volume at 5 not convincing.
| Description: |
|
| Filesize: |
87.65 KB |
| Viewed: |
331 Time(s) |
|
|
|
| Back to top |
|
 |
chandrujimrc
Brown Belt

Joined: 21 Apr 2009
Posts: 1683
|
Post: #413  Posted: Sat Apr 13, 2013 1:29 pm Post subject: Posted: Sat Apr 13, 2013 1:29 pm Post subject: |
 |
|
| Dear saumya12,untill it breakes the previous low the said pattern is valid.If you want to read the practical rules,pl go through first few pages of the other thread " Running with the wolves".
|
|
| Back to top |
|
 |
chandrujimrc
Brown Belt

Joined: 21 Apr 2009
Posts: 1683
|
Post: #414  Posted: Sat Apr 13, 2013 2:57 pm Post subject: Posted: Sat Apr 13, 2013 2:57 pm Post subject: |
 |
|
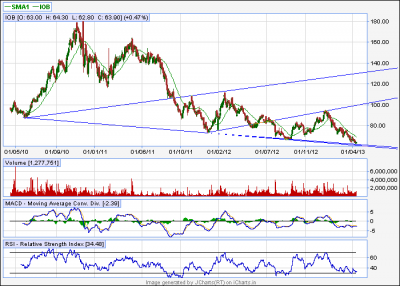
I think any time IOB will reverse to upside.
| Description: |
|
| Filesize: |
18.76 KB |
| Viewed: |
291 Time(s) |
|
|
|
| Back to top |
|
 |
vinay28
Black Belt

Joined: 24 Dec 2010
Posts: 11748
|
Post: #415  Posted: Sat Apr 13, 2013 5:00 pm Post subject: Posted: Sat Apr 13, 2013 5:00 pm Post subject: |
 |
|
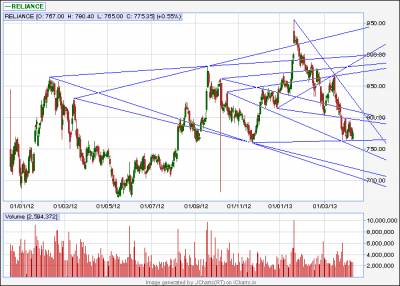
RIL daily chart - Targets of two -WWs in the middle already met. If results are bad, two left side -WWs targets is 715/700. If results are good, right side +ww target is 900. I am worried about it.
I intend to get out if it goes to 805/815 by Tuesday. SL 764 on daily close basis or 760 intraday on 30tf basis.
| Description: |
|
| Filesize: |
17.1 KB |
| Viewed: |
316 Time(s) |
|
|
|
| Back to top |
|
 |
vinay28
Black Belt

Joined: 24 Dec 2010
Posts: 11748
|
Post: #416  Posted: Sat Apr 13, 2013 5:14 pm Post subject: Posted: Sat Apr 13, 2013 5:14 pm Post subject: |
 |
|
| vinay28 wrote: | RIL daily chart - Targets of two -WWs in the middle already met. If results are bad, two left side -WWs targets is 715/700. If results are good, right side +ww target is 900. I am worried about it.
I intend to get out if it goes to 805/815 by Tuesday. SL 764 on daily close basis or 760 intraday on 30tf basis. |
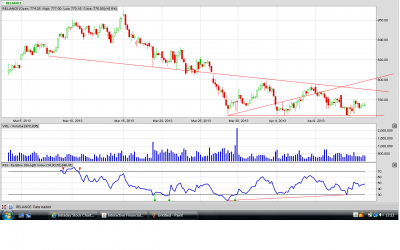
This is why RIL worries me. The middle line is acting as resistance.
| Description: |
|
| Filesize: |
86.49 KB |
| Viewed: |
289 Time(s) |
|
|
|
| Back to top |
|
 |
chetan83
Brown Belt

Joined: 19 Feb 2010
Posts: 2036
|
Post: #417  Posted: Sat Apr 13, 2013 6:03 pm Post subject: Posted: Sat Apr 13, 2013 6:03 pm Post subject: |
 |
|
| vinay28 wrote: | | vinay28 wrote: | RIL daily chart - Targets of two -WWs in the middle already met. If results are bad, two left side -WWs targets is 715/700. If results are good, right side +ww target is 900. I am worried about it.
I intend to get out if it goes to 805/815 by Tuesday. SL 764 on daily close basis or 760 intraday on 30tf basis. |
This is why RIL worries me. The middle line is acting as resistance. |
My bet will on RIL touching 720.....so for this month buying 740 PE would be a good speculation.
|
|
| Back to top |
|
 |
chandrujimrc
Brown Belt

Joined: 21 Apr 2009
Posts: 1683
|
Post: #418  Posted: Sat Apr 13, 2013 6:49 pm Post subject: Posted: Sat Apr 13, 2013 6:49 pm Post subject: |
 |
|
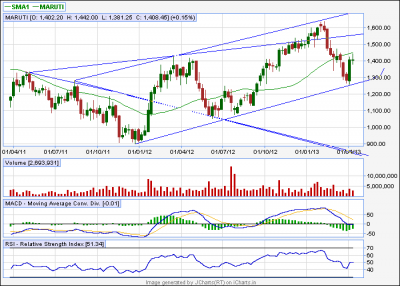
Maruti clear cut weekly and daily -WW.
| Description: |
|
| Filesize: |
15.18 KB |
| Viewed: |
299 Time(s) |
|
|
|
| Back to top |
|
 |
chandrujimrc
Brown Belt

Joined: 21 Apr 2009
Posts: 1683
|
Post: #419  Posted: Sat Apr 13, 2013 6:50 pm Post subject: Posted: Sat Apr 13, 2013 6:50 pm Post subject: |
 |
|
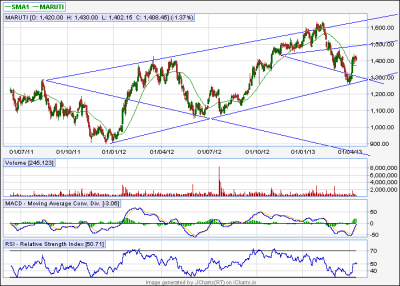
Maruti daily -WW,but one small +WW going on.
| Description: |
|
| Filesize: |
19.49 KB |
| Viewed: |
284 Time(s) |
|
|
|
| Back to top |
|
 |
chetan83
Brown Belt

Joined: 19 Feb 2010
Posts: 2036
|
|
| Back to top |
|
 |
|

