| View previous topic :: View next topic |
| Author |
WW ON EOD CHARTS |
apka
Black Belt

Joined: 13 Dec 2011
Posts: 6137
|
Post: #511  Posted: Sat Jun 08, 2013 12:02 pm Post subject: Posted: Sat Jun 08, 2013 12:02 pm Post subject: |
 |
|
hey u wrote something vishy 
|
|
| Back to top |
|
 |
|
|
 |
apka
Black Belt

Joined: 13 Dec 2011
Posts: 6137
|
Post: #512  Posted: Sat Jun 08, 2013 12:05 pm Post subject: Posted: Sat Jun 08, 2013 12:05 pm Post subject: |
 |
|
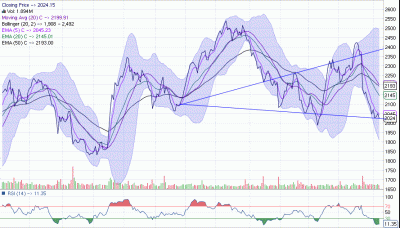
and if we look at it this way then
| Description: |
|
| Filesize: |
44.7 KB |
| Viewed: |
379 Time(s) |
|
|
|
| Back to top |
|
 |
vishyvaranasi
Green Belt

Joined: 11 Jul 2011
Posts: 1159
|
Post: #513  Posted: Sat Jun 08, 2013 12:07 pm Post subject: Posted: Sat Jun 08, 2013 12:07 pm Post subject: |
 |
|
| apka wrote: | hey u wrote something vishy  |
.
Ya Apka,
Just wanted to let you know the WW u hav drawn is incorrect as the Trendlines are diverging.By the way there was a -WW starting from 2-4-13 as Point 1.Thought of posting the chart as well but wasnt able to. 
|
|
| Back to top |
|
 |
vishyvaranasi
Green Belt

Joined: 11 Jul 2011
Posts: 1159
|
Post: #514  Posted: Sat Jun 08, 2013 12:13 pm Post subject: Posted: Sat Jun 08, 2013 12:13 pm Post subject: |
 |
|
| apka wrote: | | and if we look at it this way then |
.
Ya Apka,
I personally Call this tweaking the Points as per our comfort presuming the market to act as we think .But i prefer to trade with P5 at 1950 only as this WW will be negated only abv 2429.So will wait patiently for that.
Vishy
|
|
| Back to top |
|
 |
apka
Black Belt

Joined: 13 Dec 2011
Posts: 6137
|
Post: #515  Posted: Sat Jun 08, 2013 12:57 pm Post subject: Posted: Sat Jun 08, 2013 12:57 pm Post subject: |
 |
|
ok thank you, got u 
|
|
| Back to top |
|
 |
tuks87
White Belt

Joined: 02 Sep 2011
Posts: 13
|
Post: #516  Posted: Sat Jun 08, 2013 1:04 pm Post subject: Posted: Sat Jun 08, 2013 1:04 pm Post subject: |
 |
|
Hi,
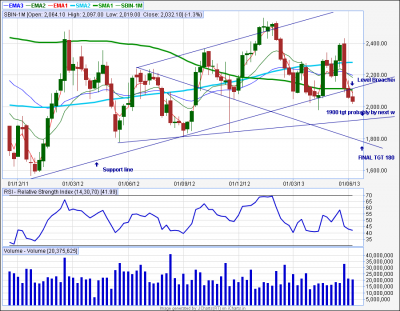
I may be wrong but propbably feel that SBIN can touch 1900-1950 levels for next week and final target of 1800 levels can be achieved by end of the series.
With the spike in Dollar, pressure on Bank Nifty and Bad results by SBIN, i think it is very much possible.
I made a good short at 2400 levels and probably planning to close after next week RBI policy comments.
| Description: |
|
| Filesize: |
60.19 KB |
| Viewed: |
394 Time(s) |
|
|
|
| Back to top |
|
 |
tuks87
White Belt

Joined: 02 Sep 2011
Posts: 13
|
Post: #517  Posted: Sat Jun 08, 2013 1:16 pm Post subject: Posted: Sat Jun 08, 2013 1:16 pm Post subject: |
 |
|
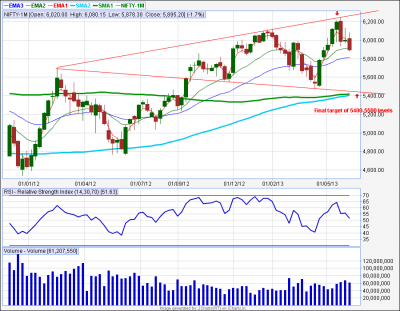
I Found these weekly wolf wave on nifty. It is going good for a target of 5400-5500 by these series or next series.
Accumulating puts of 5500-5600 of current and next series seems to be a good bet and reward ratio also seems to be good.
I feel Dollar is going to play spoil sport for the market and the macros are still not upto the mark. The only thing supporting the market currently is IT sector with likes of TCS, Infy and HCL tech.
Sectorial Bearishness is already seen in Auto and Pharma and Financials can be next target.
The above is my Outlook on market.
| Description: |
|
| Filesize: |
46.93 KB |
| Viewed: |
425 Time(s) |
|
|
|
| Back to top |
|
 |
apka
Black Belt

Joined: 13 Dec 2011
Posts: 6137
|
Post: #518  Posted: Sat Jun 08, 2013 1:21 pm Post subject: Posted: Sat Jun 08, 2013 1:21 pm Post subject: |
 |
|
| i think ur weekly chart is wrong, 2nd point is below 1?
|
|
| Back to top |
|
 |
tuks87
White Belt

Joined: 02 Sep 2011
Posts: 13
|
Post: #519  Posted: Sat Jun 08, 2013 1:28 pm Post subject: Posted: Sat Jun 08, 2013 1:28 pm Post subject: |
 |
|
In which chart apka? Sbin or nifty
Nifty
Point 1-2 5700-4760
Point 2-3 4760-6120
Point 3-4 6120-5480
Point 4-5 :-5480-6239
Point 5-6 : 6239-5500-5400 tgt.
|
|
| Back to top |
|
 |
sprithiani
White Belt

Joined: 17 Feb 2010
Posts: 1
|
Post: #520  Posted: Sat Jun 08, 2013 2:51 pm Post subject: WW ON EOD CHARTS Posted: Sat Jun 08, 2013 2:51 pm Post subject: WW ON EOD CHARTS |
 |
|
Guys,
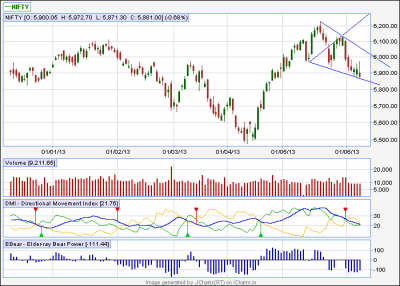
Please check the attached chart. Is this a valid WW?[img][/img]
| Description: |
|
| Filesize: |
14.01 KB |
| Viewed: |
412 Time(s) |
|
|
|
| Back to top |
|
 |
vinay28
Black Belt

Joined: 24 Dec 2010
Posts: 11748
|
Post: #521  Posted: Sat Jun 08, 2013 4:48 pm Post subject: Re: WW ON EOD CHARTS Posted: Sat Jun 08, 2013 4:48 pm Post subject: Re: WW ON EOD CHARTS |
 |
|
| sprithiani wrote: | Guys,
Please check the attached chart. Is this a valid WW?[img][/img] |
this has already been posted a number of times in the past. Probably green candle at point 5 will happen on monday.
|
|
| Back to top |
|
 |
chetan83
Brown Belt

Joined: 19 Feb 2010
Posts: 2037
|
Post: #522  Posted: Wed Jun 12, 2013 9:11 pm Post subject: PFC EOD Posted: Wed Jun 12, 2013 9:11 pm Post subject: PFC EOD |
 |
|
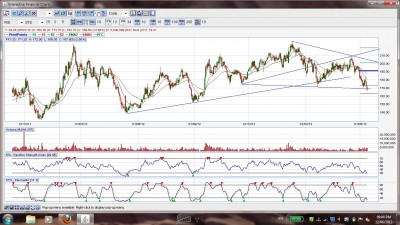
GOOD CANDIDATE
AWAITING FOR CONFIRMATION (NOT TRADING TOUGH)
T - 193, 215+++
| Description: |
|
| Filesize: |
374.47 KB |
| Viewed: |
402 Time(s) |
|
|
|
| Back to top |
|
 |
rk_a2003
Black Belt

Joined: 21 Jan 2010
Posts: 2734
|
Post: #523  Posted: Sat Jun 15, 2013 1:28 pm Post subject: Posted: Sat Jun 15, 2013 1:28 pm Post subject: |
 |
|
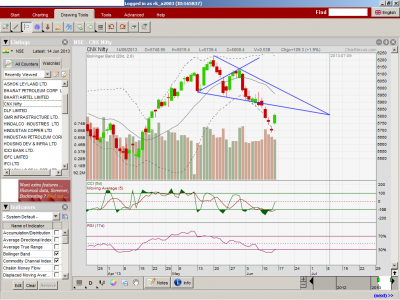
Nifty +ww (EOD).The overshoot appears to be overstretched.Is it still a valid ww?.
| Description: |
|
| Filesize: |
126.23 KB |
| Viewed: |
378 Time(s) |
|
|
|
| Back to top |
|
 |
vinay28
Black Belt

Joined: 24 Dec 2010
Posts: 11748
|
Post: #524  Posted: Sat Jun 15, 2013 1:53 pm Post subject: Posted: Sat Jun 15, 2013 1:53 pm Post subject: |
 |
|
| rk_a2003 wrote: | | Nifty +ww (EOD).The overshoot appears to be overstretched.Is it still a valid ww?. |
the problem is not the undershoot as much the fact that it has made lower highs consistently, something that Bill Wolfe called a wobble, which is to be avoided. Anyway, entry is yet to come. Presently the price is not even in the sweet zone.
|
|
| Back to top |
|
 |
reachchirag
White Belt

Joined: 28 Nov 2012
Posts: 102
|
Post: #525  Posted: Sat Jun 15, 2013 2:01 pm Post subject: +ww and -ww Posted: Sat Jun 15, 2013 2:01 pm Post subject: +ww and -ww |
 |
|
Dear Vinay,
Sorry to ask a stupid question. Can you please help me by answering +ww means going short or going long.
|
|
| Back to top |
|
 |
|

