| View previous topic :: View next topic |
| Author |
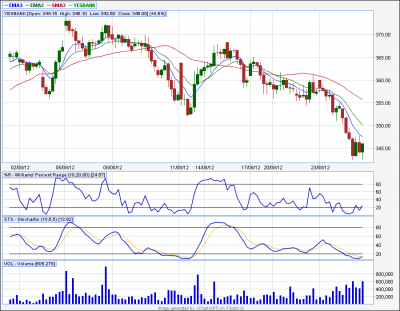
Yes Bank Daily Chart Vision |
bolband_macd
White Belt

Joined: 06 Sep 2011
Posts: 104
|
|
| Back to top |
|
 |
|
|
 |
svkum
White Belt

Joined: 14 Feb 2007
Posts: 321
|
Post: #2  Posted: Sat Aug 25, 2012 4:22 pm Post subject: Posted: Sat Aug 25, 2012 4:22 pm Post subject: |
 |
|
BB ,
i am using BOS oscillator like this ,
selling triggers when it crosses 1 from above, shorting betwen 1 and 0 ( may be immdtly after crossing 1.
squareing off when it reverses from -1 or 0 from below.
likewise , for buying
buying after it crosses -1 from below , buy between -1 and 0
squaring off when it crosses 1 from above.
for longer tf and longer profits- use BOS(9), BOS(20), BOS(30)
and by the way i am not that great 
|
|
| Back to top |
|
 |
bolband_macd
White Belt

Joined: 06 Sep 2011
Posts: 104
|
Post: #3  Posted: Sun Aug 26, 2012 11:33 am Post subject: Posted: Sun Aug 26, 2012 11:33 am Post subject: |
 |
|
Namaskaar svkum sir,
Thanks for showing interest in this post and extra thanks for your views and inputs regarding BOS Oscillator.
One can refine the strategy in Yes Bank according to your suggestion and reap ample profits.
Sir, please suggest TF used with BOS for short term entry in cash trade.
Best Regards,
BM
|
|
| Back to top |
|
 |
chennuru
White Belt

Joined: 07 Jan 2011
Posts: 93
|
Post: #4  Posted: Mon Aug 27, 2012 1:48 am Post subject: Posted: Mon Aug 27, 2012 1:48 am Post subject: |
 |
|
Dear All
Please check 60 tf yes bank,
short on pull backs, this is my view on yes bank
| Description: |
|
| Filesize: |
47.51 KB |
| Viewed: |
456 Time(s) |

|
|
|
| Back to top |
|
 |
bolband_macd
White Belt

Joined: 06 Sep 2011
Posts: 104
|
Post: #5  Posted: Tue Aug 28, 2012 1:43 pm Post subject: Re: Yes Bank Daily Chart Vision Posted: Tue Aug 28, 2012 1:43 pm Post subject: Re: Yes Bank Daily Chart Vision |
 |
|
| bolband_macd wrote: | Friends,
See attached Channeled Daily chart pattern of Yes Bank. On friday, the channel is broken.
Observe the BOS oscillator activity. (This oscillator is introduced to me by the great SVKUM sir) Its at its lowest. Now, lets watch the price move in upward direction and so as BOC Oscillator (Might as well be a "Bull Trap").
Once the BOC Oscillator line stops its upward move and reverses, Price will head towards "New Low".
Lets watch the fun.
Trade Safe,
BM  |
Woooooo,
New lows achieved there. Please reduce positions and keep strict TSL. Enjoy
Trade Safe,
BM 
|
|
| Back to top |
|
 |
ian_botham47
White Belt

Joined: 09 May 2007
Posts: 12
|
Post: #6  Posted: Tue Aug 28, 2012 6:32 pm Post subject: bolband_macd Posted: Tue Aug 28, 2012 6:32 pm Post subject: bolband_macd |
 |
|
S V Kum Sir,
Pl. refer to your analysis on 'Yes Bank' in the context of bolband_macd. I feel that it is bollinger b%. Where is it available in i-charts?
If it is not there pl arrange to introduce it in i_chart technicals.
Regards,
ian_botham47
|
|
| Back to top |
|
 |
svkum
White Belt

Joined: 14 Feb 2007
Posts: 321
|
Post: #7  Posted: Tue Aug 28, 2012 6:43 pm Post subject: Posted: Tue Aug 28, 2012 6:43 pm Post subject: |
 |
|
yes its bollinger oscillator,
ita available in jcharts premium
pl see BOS oscillator in the list , put whateve parameters in that which suits you.
|
|
| Back to top |
|
 |
|

